 ▶
▶
 ▶
▶Medical Bills & Health Insurance Command Center
The cheapest premium is the most expensive plan.
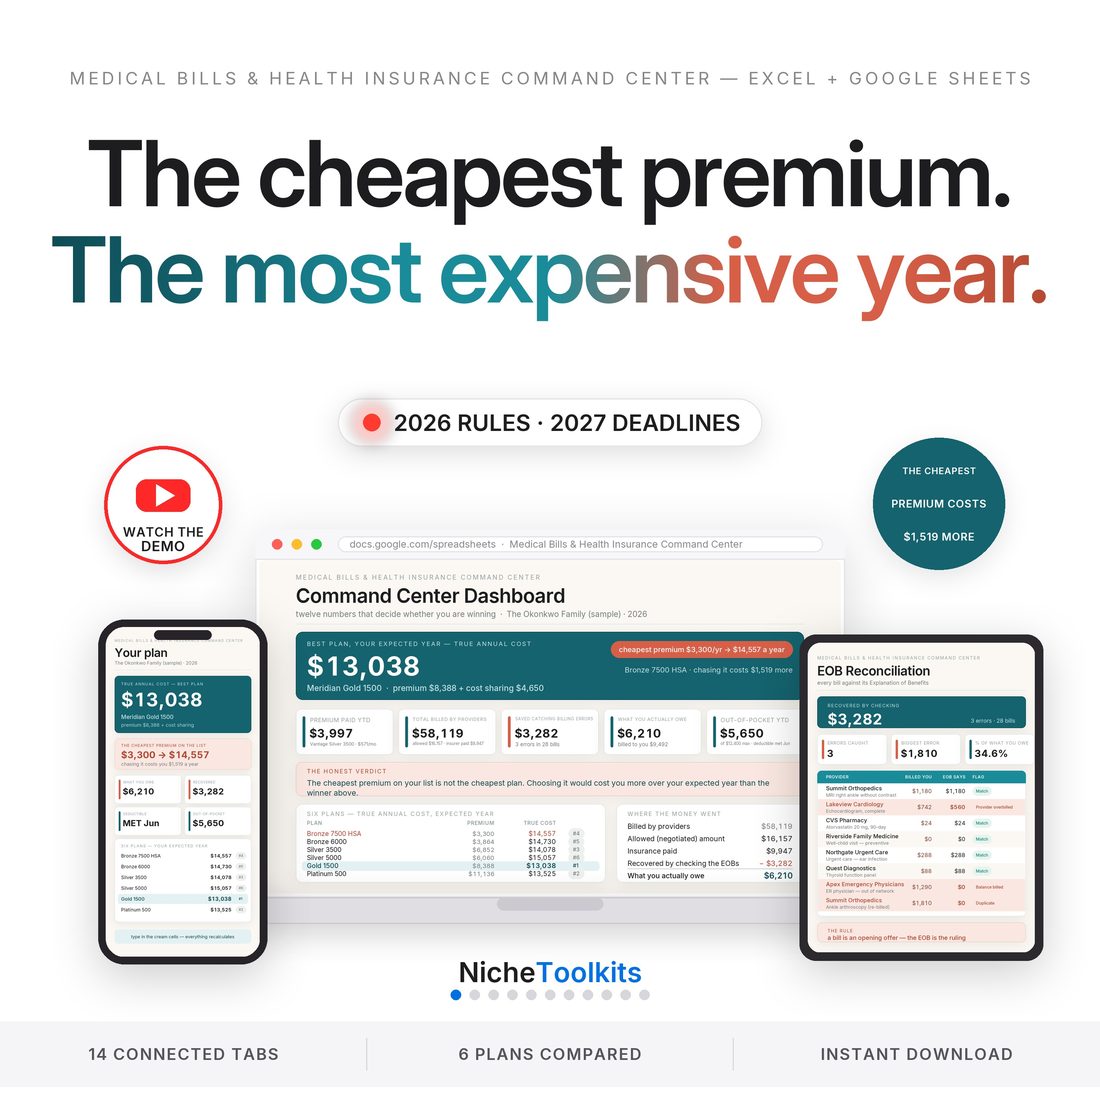
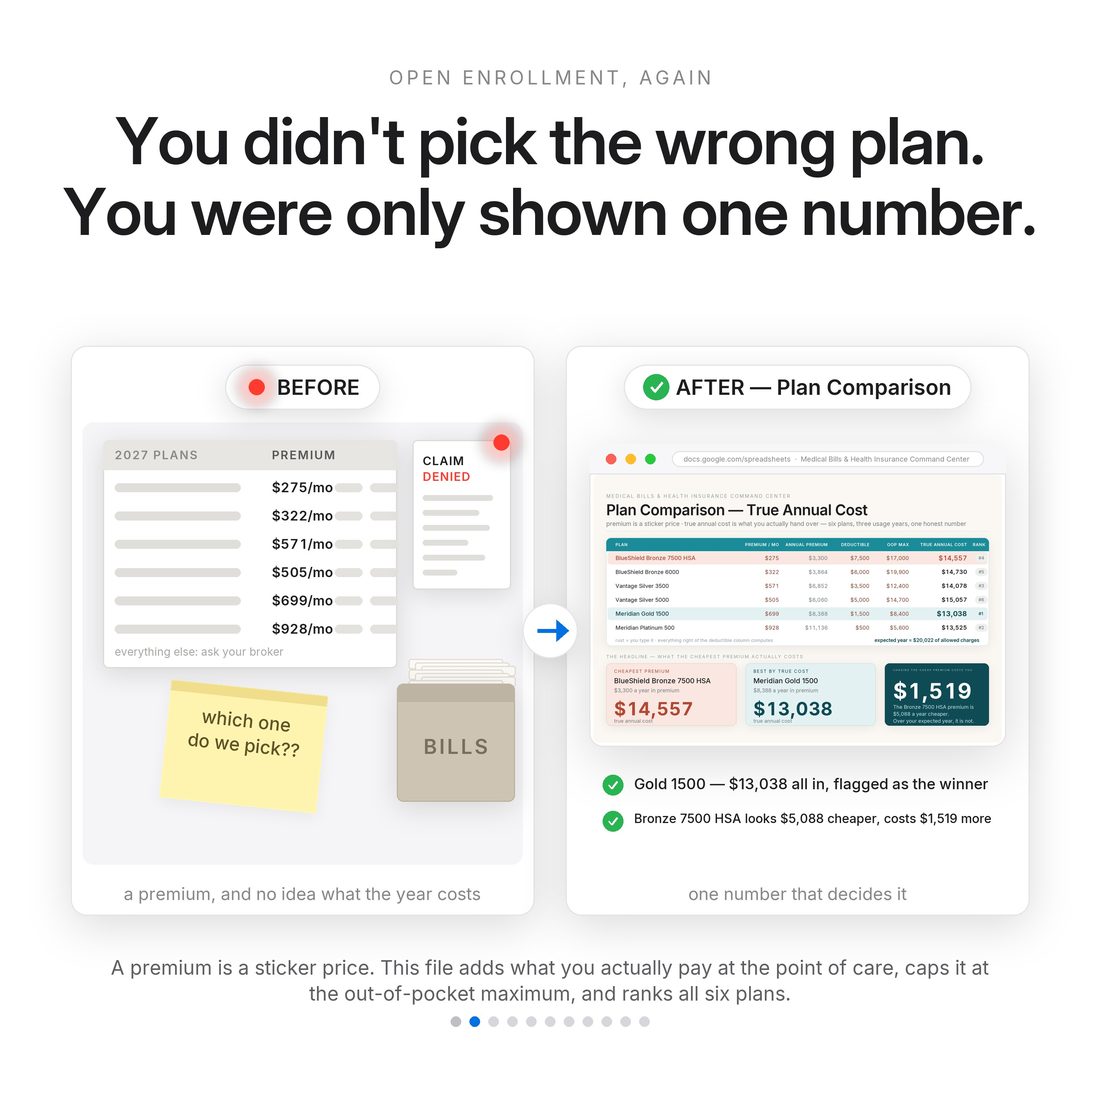
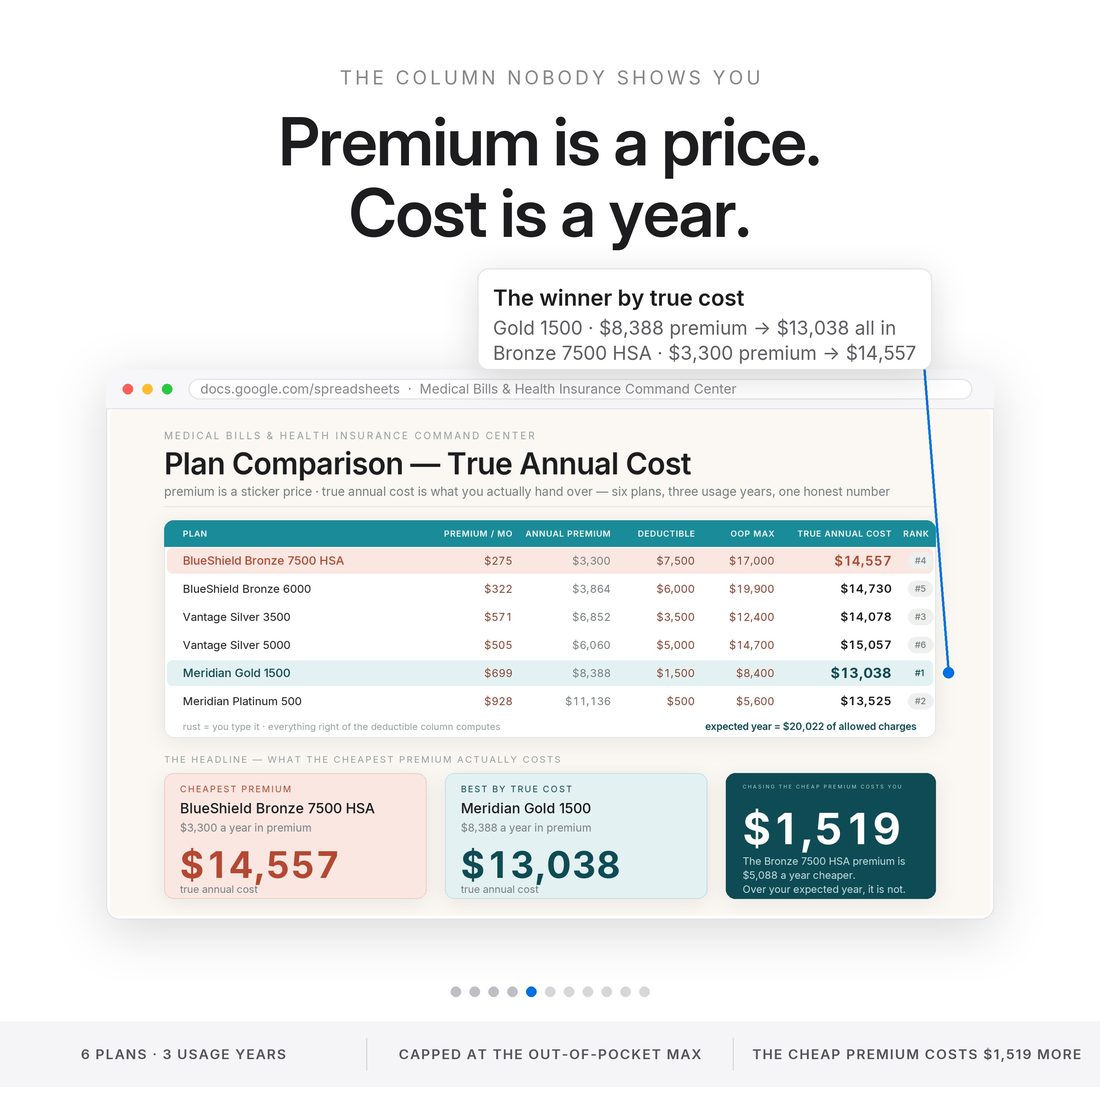
Every open enrollment you are shown one number — the monthly premium — and asked to bet a year of your family's health on it. The premium is a price. The plan is a cost. This 14-tab workbook turns the second one into a number you can actually compare. In the sample year that ships inside, the lowest-premium plan on the grid costs $3,300 a year in premiums and $14,557 all in, while the $8,388 plan costs $13,038 all in. Chasing the cheap premium costs $1,519, and the grid never shows you that.
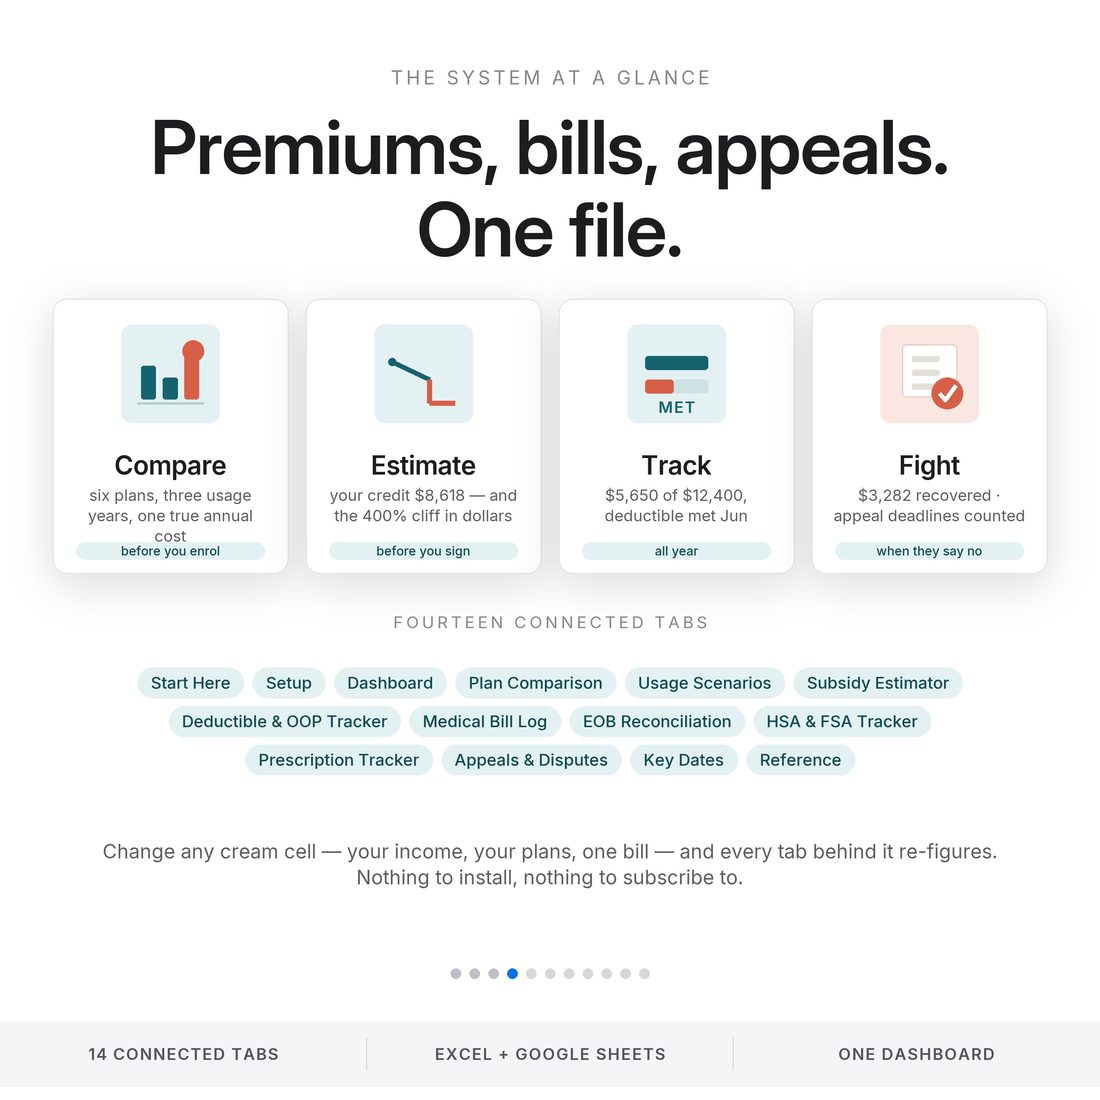
- Plan Comparison — true annual cost rather than the premium: $14,557 all in for the cheap-premium plan against $13,038 for the $8,388 one
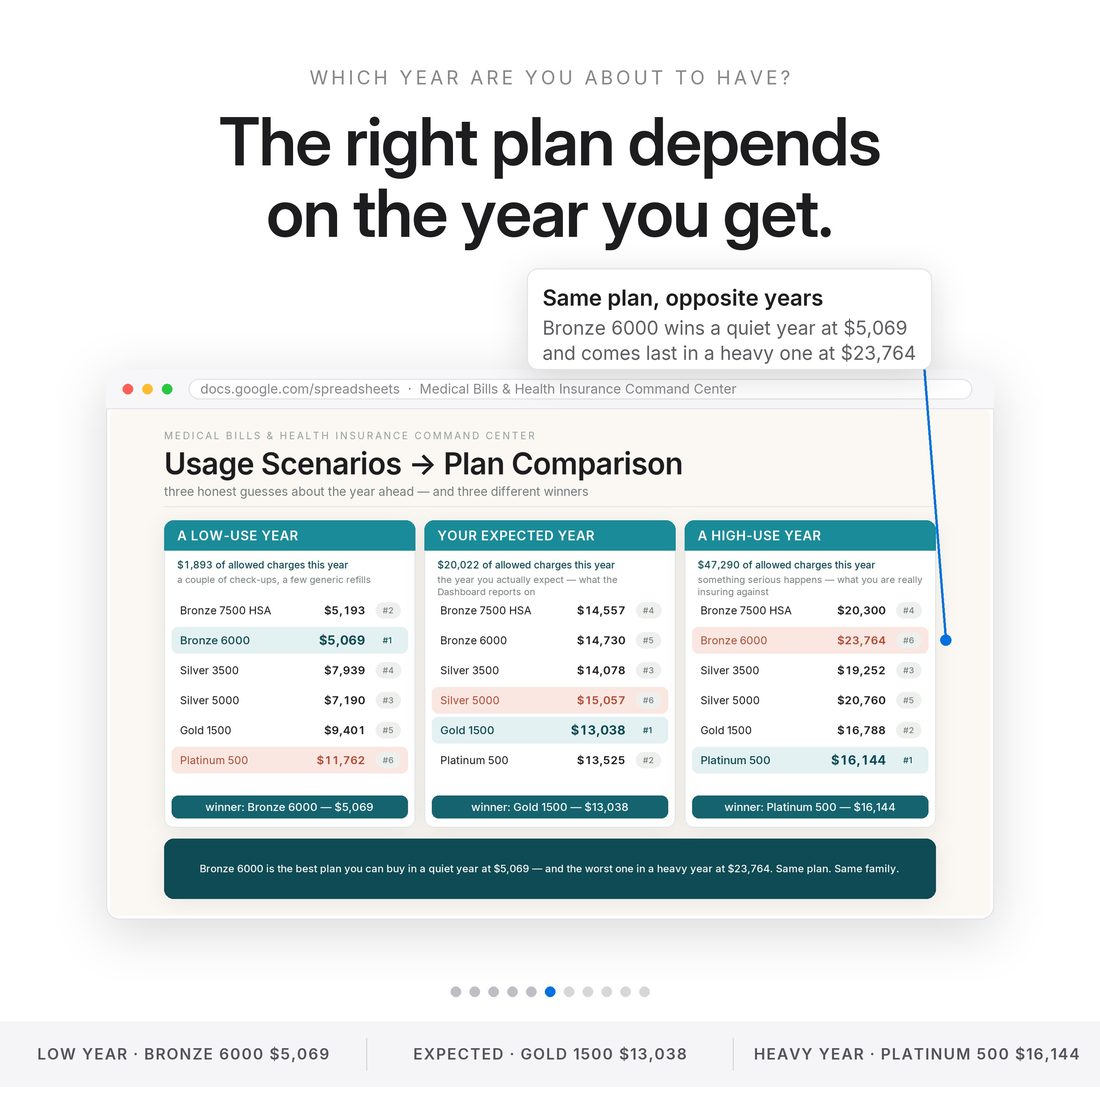
- Usage Scenarios — a low-use year, an expected year and a heavy year, each crowning a different plan
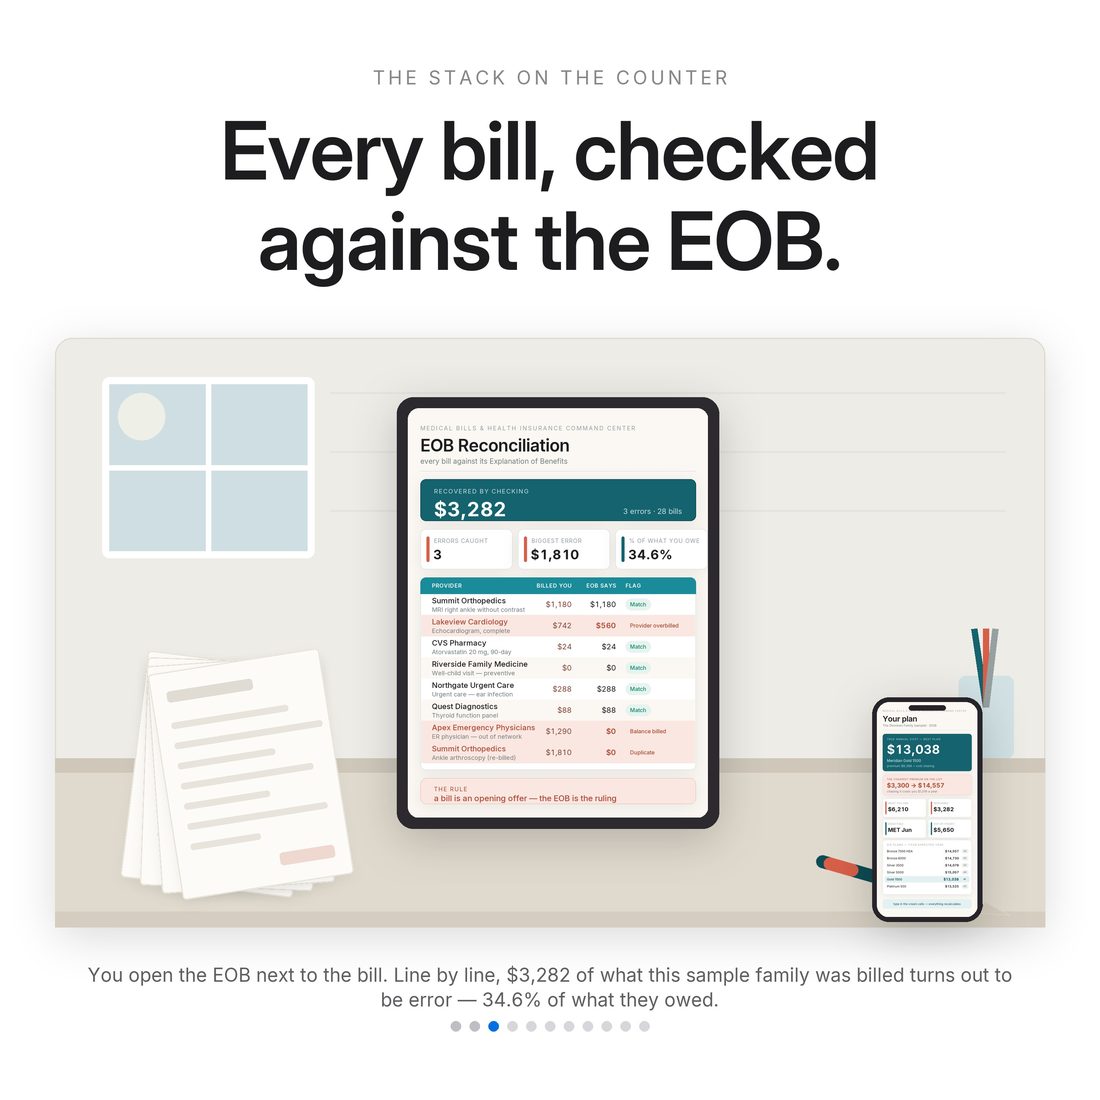
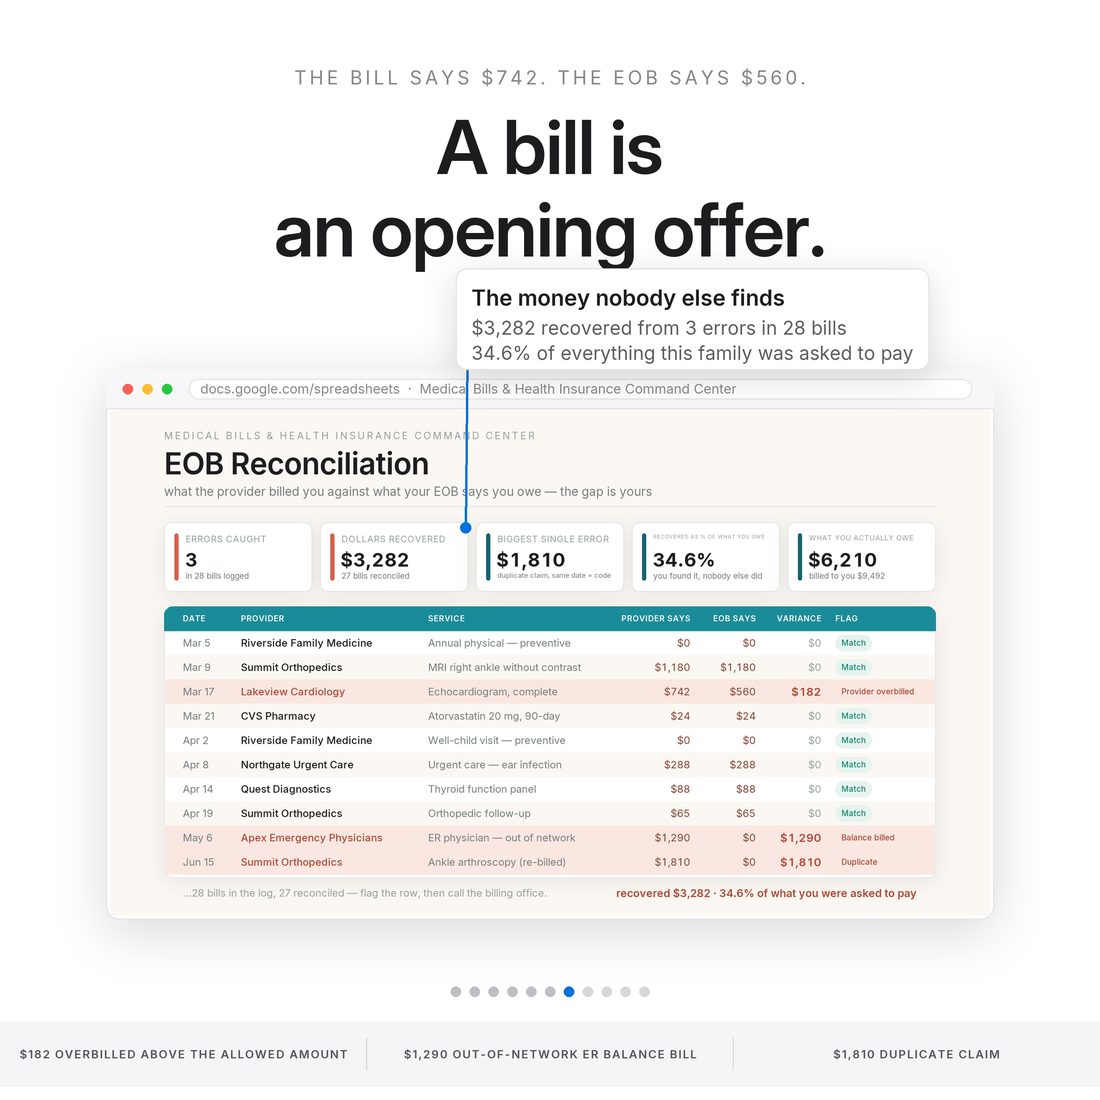
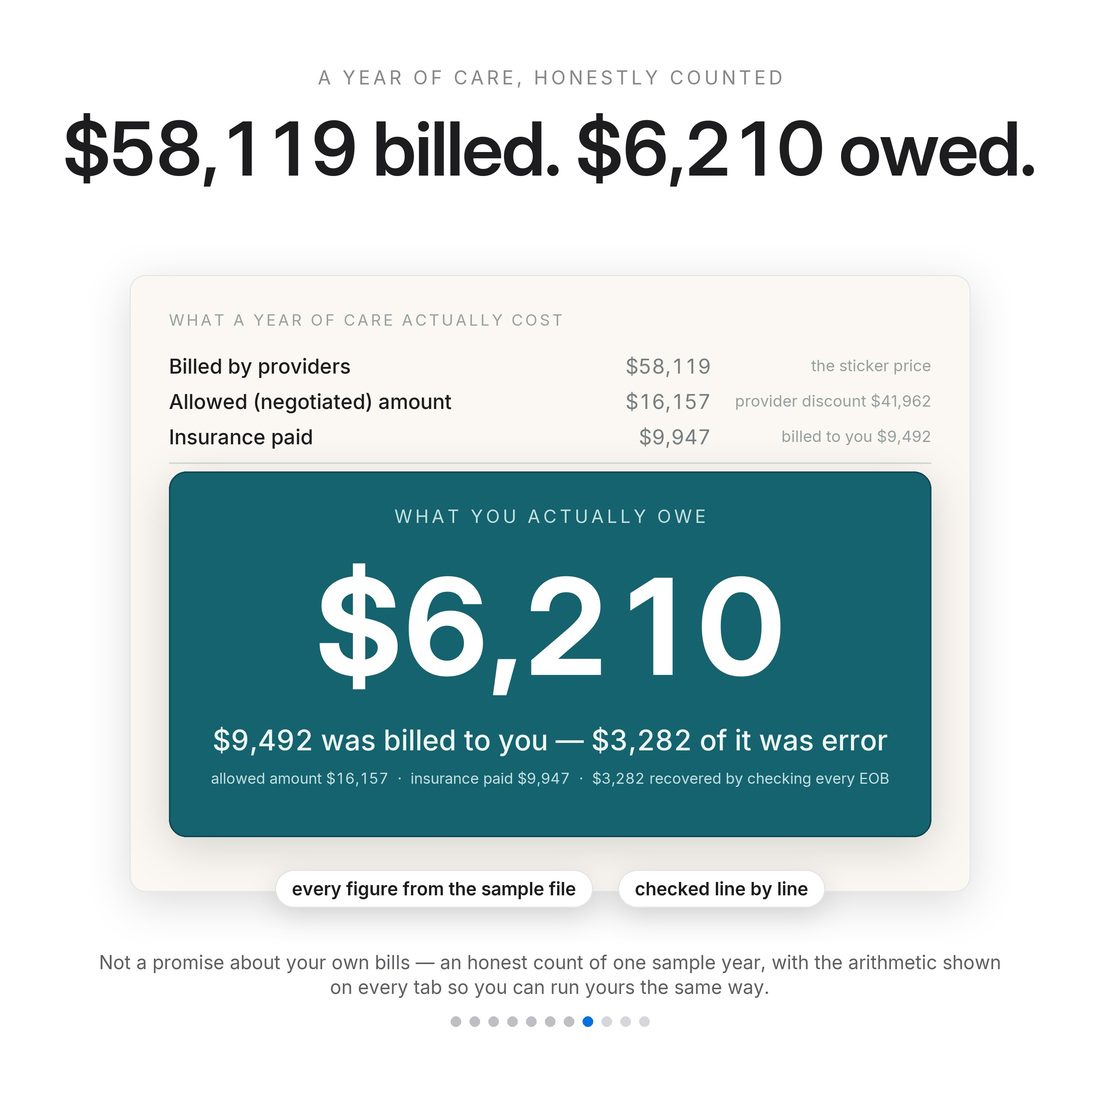
- Medical Bill Log & EOB Reconciliation — $3,282 recovered from 3 billing errors across 28 bills in the sample, 34.6% of what was billed
- Subsidy Estimator — the 400% FPL cliff priced at $4,536 for one dollar of income over the line
- HSA & FSA Tracker with a Deductible & OOP Tracker — contributions and running totals in the same file as the bills
Overview
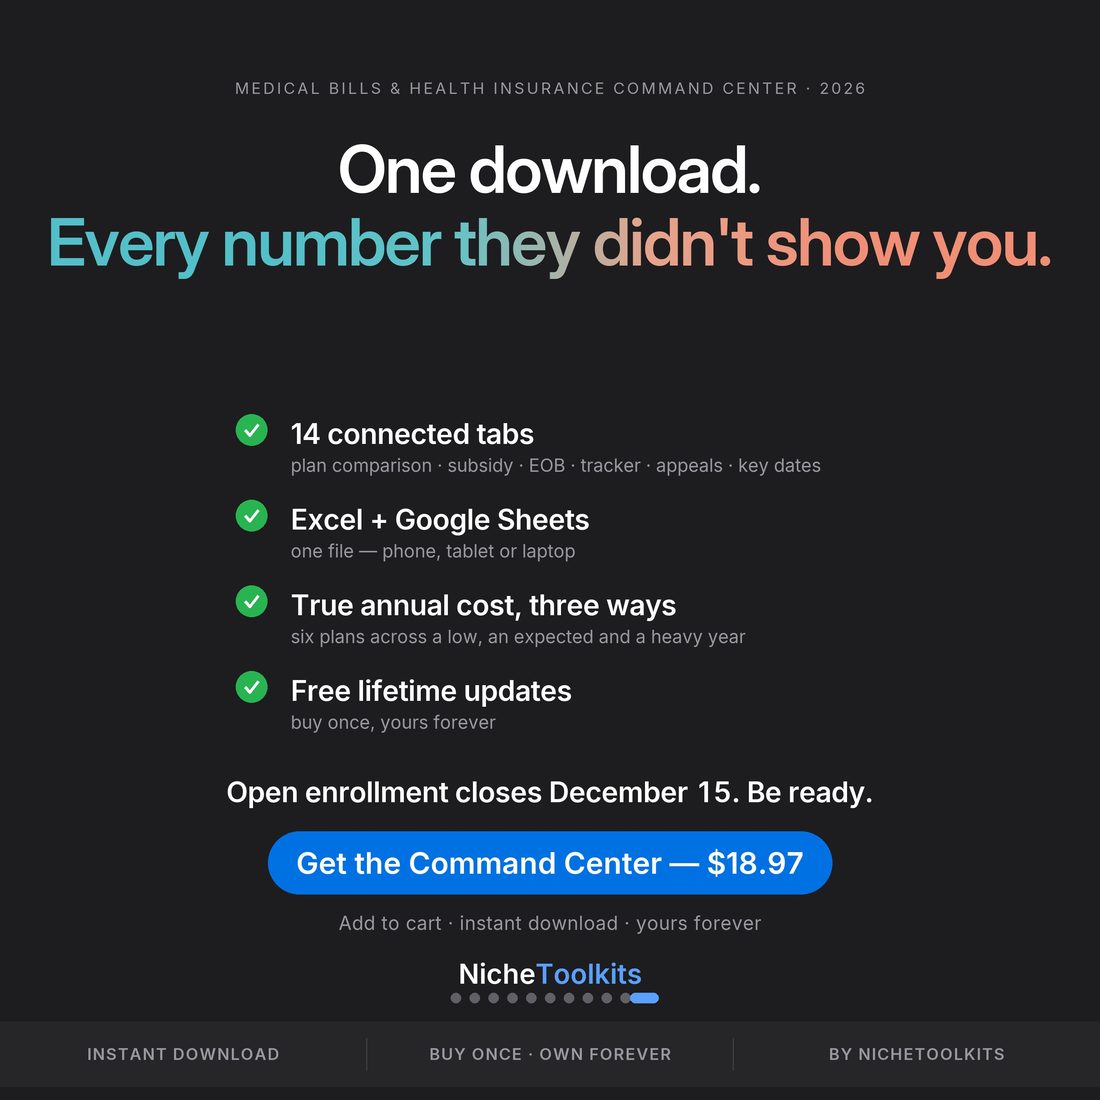
Open enrollment closes December 15. Be ready.
Every open enrollment you are shown one number — the monthly premium — and asked to bet a year of your family's health on it. The premium is a price. The plan is a cost. This 14-tab workbook turns the second one into a number you can actually compare. In the sample year that ships inside, the lowest-premium plan on the grid costs $3,300 a year in premiums and $14,557 all in, while the $8,388 plan costs $13,038 all in. Chasing the cheap premium costs $1,519, and the grid never shows you that.
There is no best plan — only the best plan for the year you actually have. Three usage years run side by side, a low-use year, an expected year and a heavy one, and each crowns a different plan. The same file then handles what comes after you enroll: in the sample, $3,282 was recovered from 3 billing errors across 28 bills — 34.6% of what was billed. An overbill above the allowed amount, an out-of-network balance bill, a duplicate claim. A bill is an opening offer.
What's Included
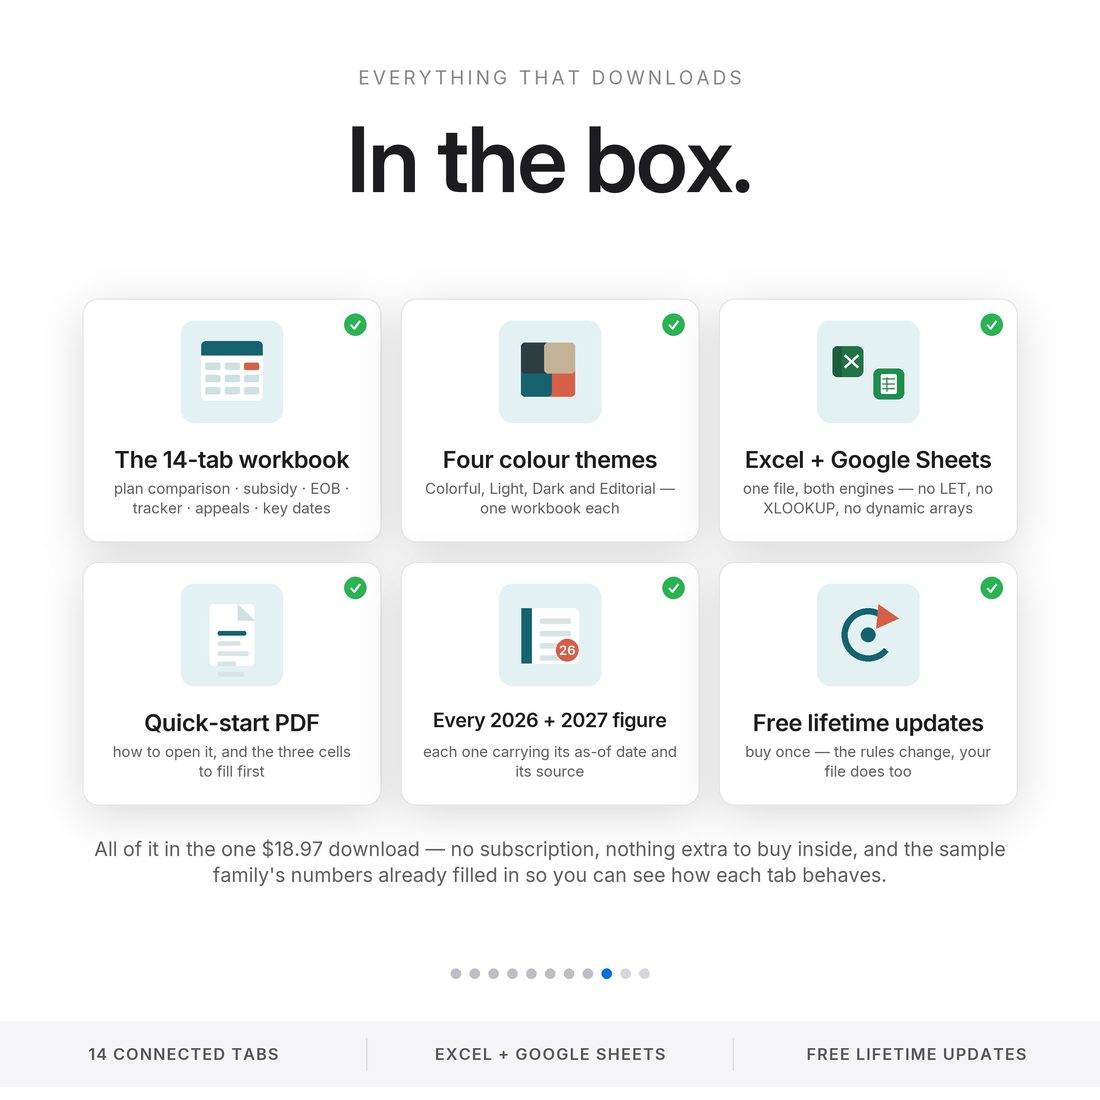
14 connected tabs:
- Four full themes — Editorial, Colorful, Light and Dark (.xlsx), the same complete engine in each
- Quick-Start-Guide.pdf — start to finish in minutes
- ACCESS-YOUR-TEMPLATE.pdf — one click opens your own copy in Google Sheets
- README and LICENSE — delivered as one ZIP, instant download
Key Benefits
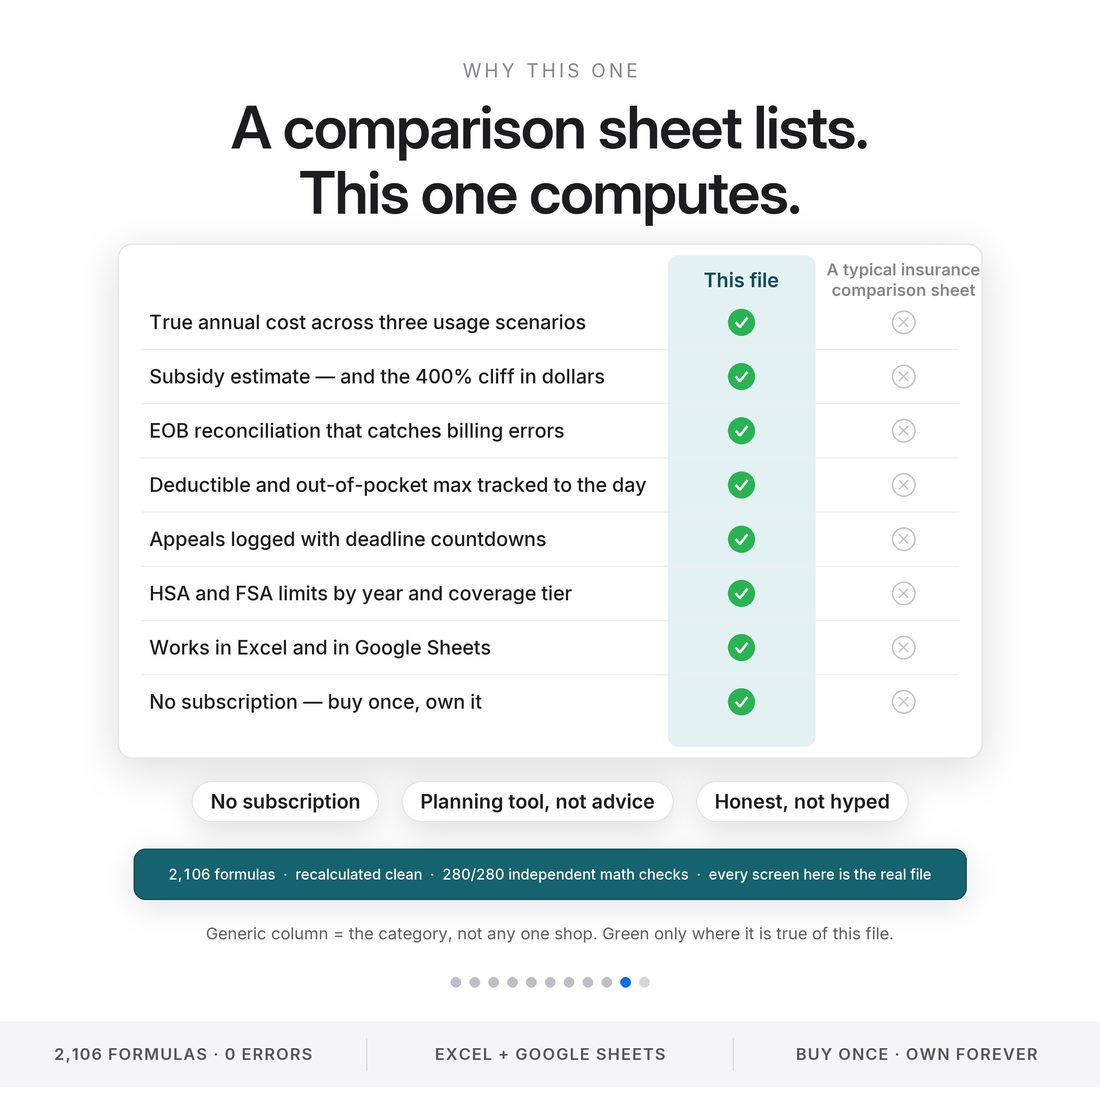
Why this one
The lowest-premium plan in the sample is $3,300 a year in premiums and $14,557 all in. The $8,388 plan lands at $13,038. Chasing the cheap premium costs $1,519.
A low-use year, an expected year and a heavy year each crown a different plan. There is no best plan — only the best plan for the year you actually have.
$3,282 recovered from 3 billing errors across 28 bills in the sample, 34.6% of what was billed: an overbill above the allowed amount, an out-of-network balance bill and a duplicate claim.
One dollar of income over the 400% FPL line costs $4,536. The Subsidy Estimator puts that number in front of you rather than behind you.
Classic, Light, Dark and Editorial ship together — same formulas, same answers, whichever you prefer to read on.
14 tabs · 2,106 formulas · recalculated clean · 280 of 280 independent math checks. Every screen in these images is the real file.
Who It's For
Built for
- Anyone choosing between plans at open enrollment with only the premium column to go on
- Households with a heavy year ahead who need the all-in number rather than the sticker one
- Anyone sitting on a stack of bills and EOBs that have never been reconciled against each other
- HSA and FSA holders who want contributions, deductible progress and out-of-pocket totals in one place
How It Works
Up and running in minutes
The ACCESS-YOUR-TEMPLATE.pdf in your download opens your own copy in Google Sheets with one click
Every plan your employer or the marketplace lists, with its own terms, on the comparison grid
Usage Scenarios prices a low-use year, an expected year and a heavy year against each plan
Medical Bill Log and EOB Reconciliation put what was billed beside what was allowed and what was paid
Appeals & Disputes tracks each challenge — the sample recovered $3,282 from three errors across 28 bills
Why It's Different
Not another template
Open enrollment hands you a grid of premiums and a deadline. It does not hand you the number that matters: what each plan costs across a year of actual use. This file computes that for three different years at once, so you can see which choice you would regret least under each, and it stays useful after you enroll by reconciling every bill against its EOB. Plan terms vary, so confirm every figure against your own Summary of Benefits and Coverage.
Delivery & Compatibility
Instant, and works with what you use
As soon as your order is complete you get instant access to download your files. Prefer Google Sheets for real-time updates and dropdowns? It's fully optimized. More comfortable in Excel? It works just as well.
Built and tested in the latest Excel (Office 365). On Mac we recommend the Google Sheets version — the template is not compatible with Apple Numbers. Available in English. The template ships with sample data so every screen works on open; clear it whenever you're ready. The images and video show that sample data to demonstrate how it looks in use.
FAQ
Questions, answered
Does it work in Google Sheets?
Yes — one click. The ACCESS-YOUR-TEMPLATE.pdf in your download opens a copy straight into Google Sheets. The .xlsx works in Excel too. No subscription, and free lifetime updates.
How does it work out the true annual cost?
You enter each plan's terms and a year of expected use, and Plan Comparison runs one against the other. In the sample, the cheap-premium plan comes to $14,557 all in and the $8,388 plan to $13,038 — a $1,519 difference the premium column never shows.
What if my year turns out differently?
That is what Usage Scenarios is for. A low-use year, an expected year and a heavy year each crown a different plan in the sample, so the choice is made against the range rather than one guess.
Can it really find billing errors?
It gives you the reconciliation, not a verdict. Put what was billed beside what the EOB allowed and the mismatches surface. In the sample year, 3 errors across 28 bills came to $3,282 — 34.6% of what was billed.
Is anything pre-loaded?
Yes — a complete sample year ships inside, so the comparison grid, the scenarios and the bill log all work the moment you open it. Clear it in one select-and-delete when you are ready.
Can I get a refund on a digital download?
Because delivery is instant, all sales are final — but message us with any issue and we'll make it right.
This is a planning tool, not medical, legal, tax or insurance advice. Plan terms vary. All figures shown are from the included sample year and are computed by the file itself. Confirm every figure against your own Summary of Benefits and Coverage before you enroll, pay a bill or file an appeal. For personal use only. © 2026 NicheToolkitHub — no resale or redistribution.