 ▶
▶
 ▶
▶Bloodwork & Longevity Command Center
Normal is a population. You are a trend.
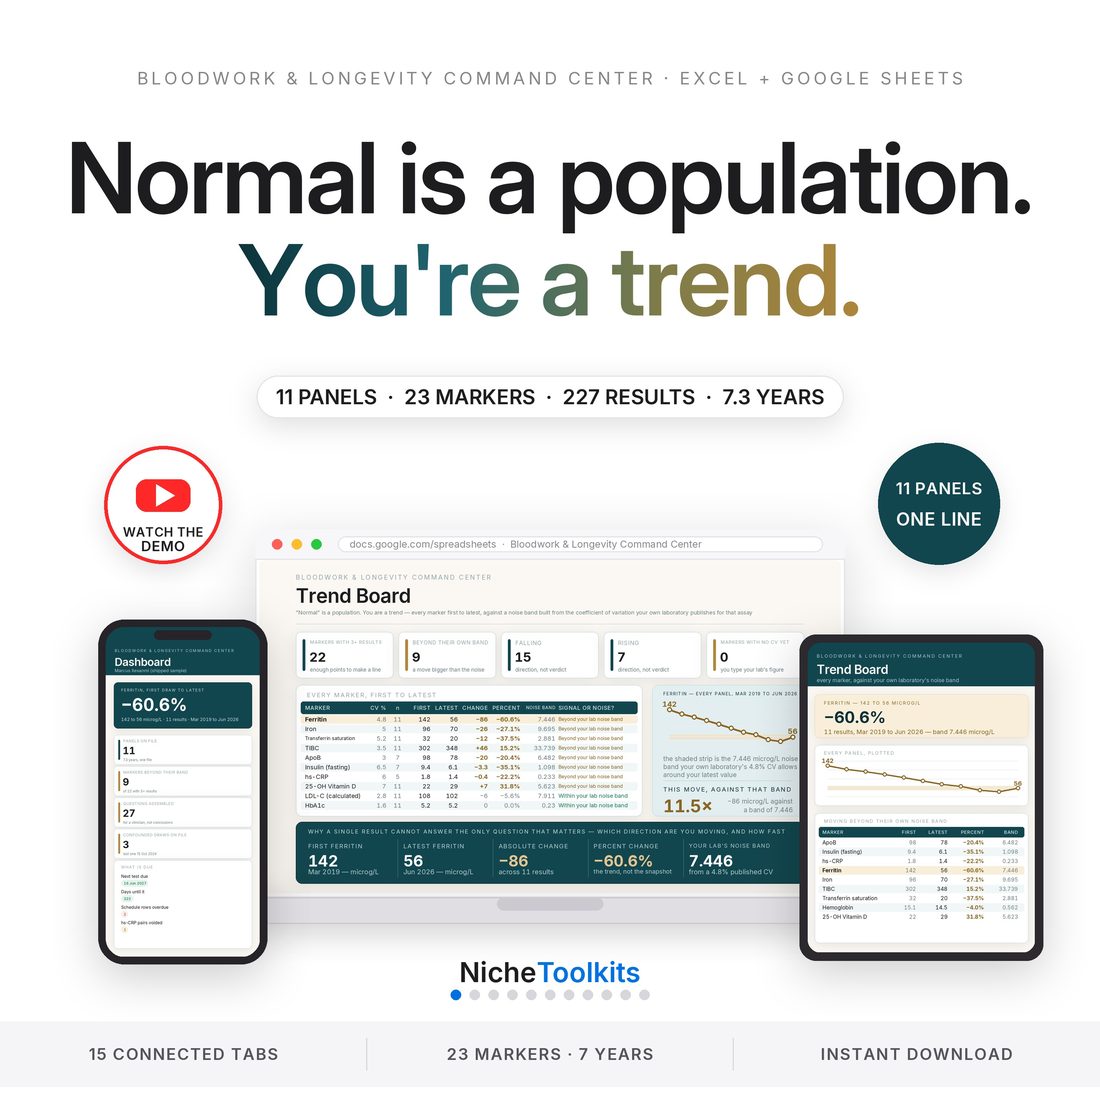
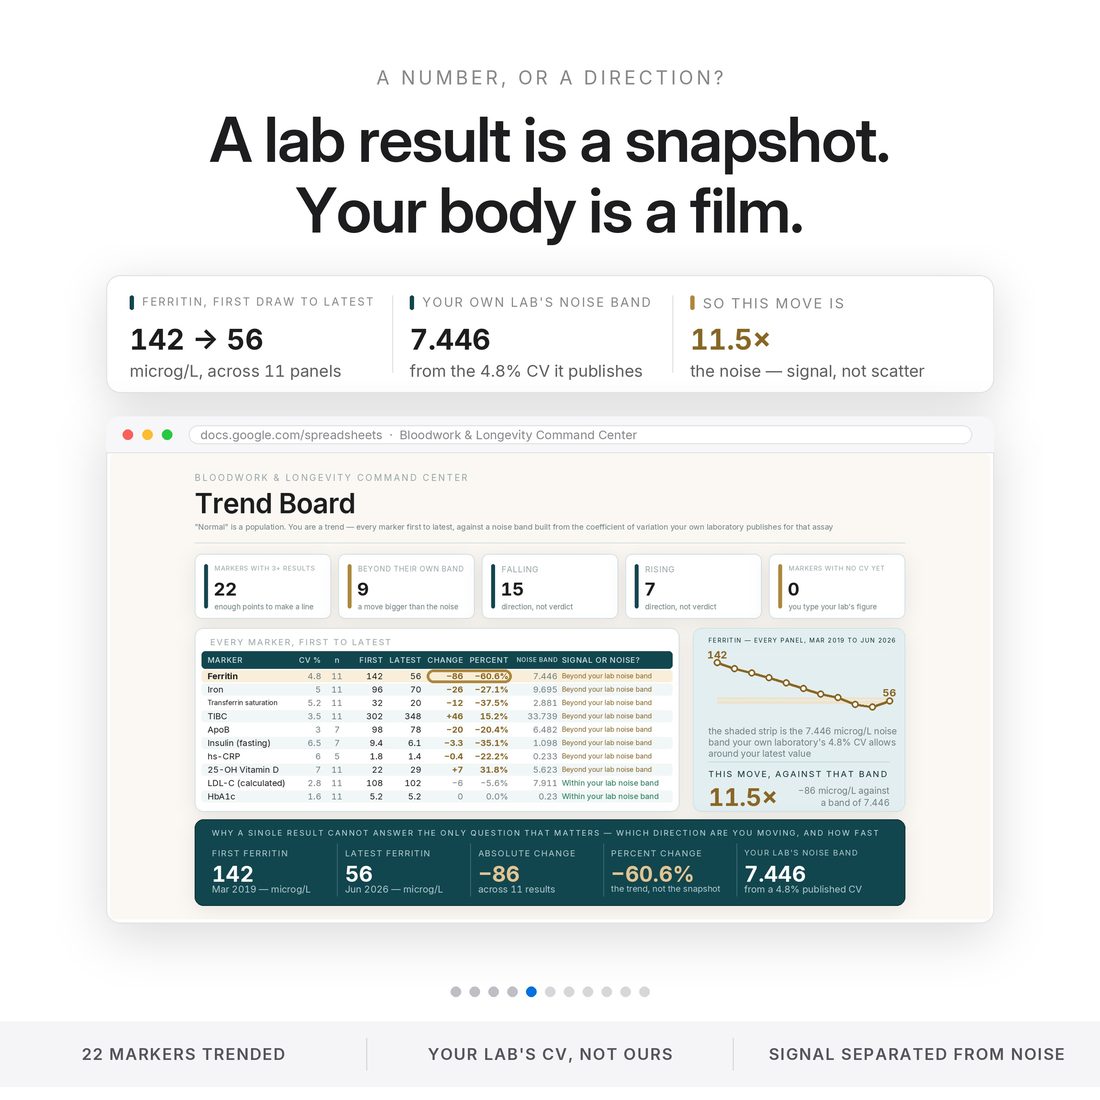
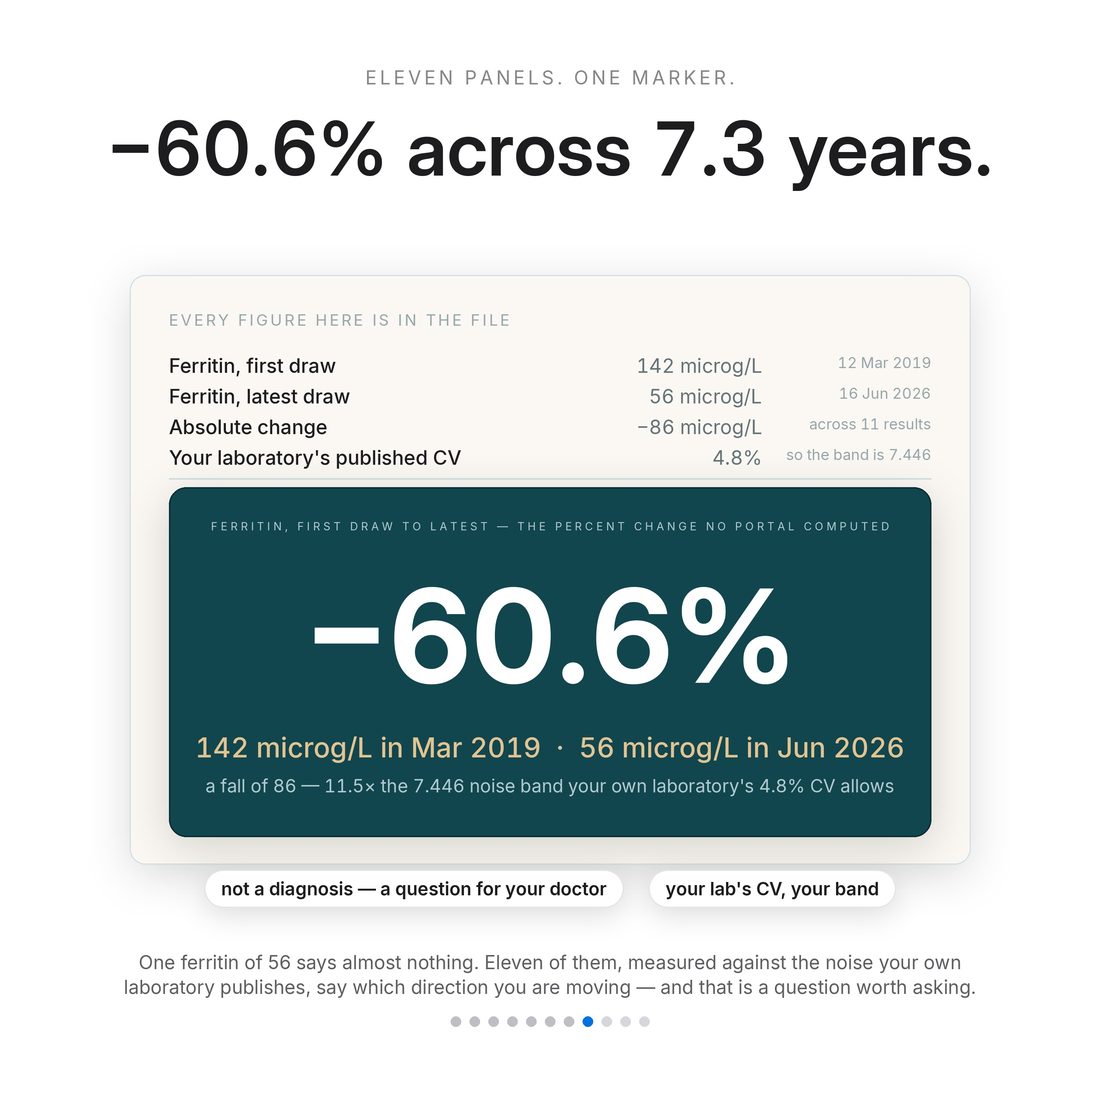
Normal is a population. You are a trend. Every lab report grades you against a band drawn from a population that includes plenty of unwell people. It answers one question: are you an outlier today. It cannot answer the one that matters — which direction are you moving, and how fast. A single ferritin value tells you nothing. A ferritin that fell from 142 to 56 across seven years is a line, and no patient portal will ever draw it, because portals are built per visit and you are not a visit. This one is built per person: you type one row per draw, and every tab redraws.
- One row per draw — 15 tabs redraw around your own history
- Noise bands from YOUR lab's published CV — movement vs noise, told apart honestly
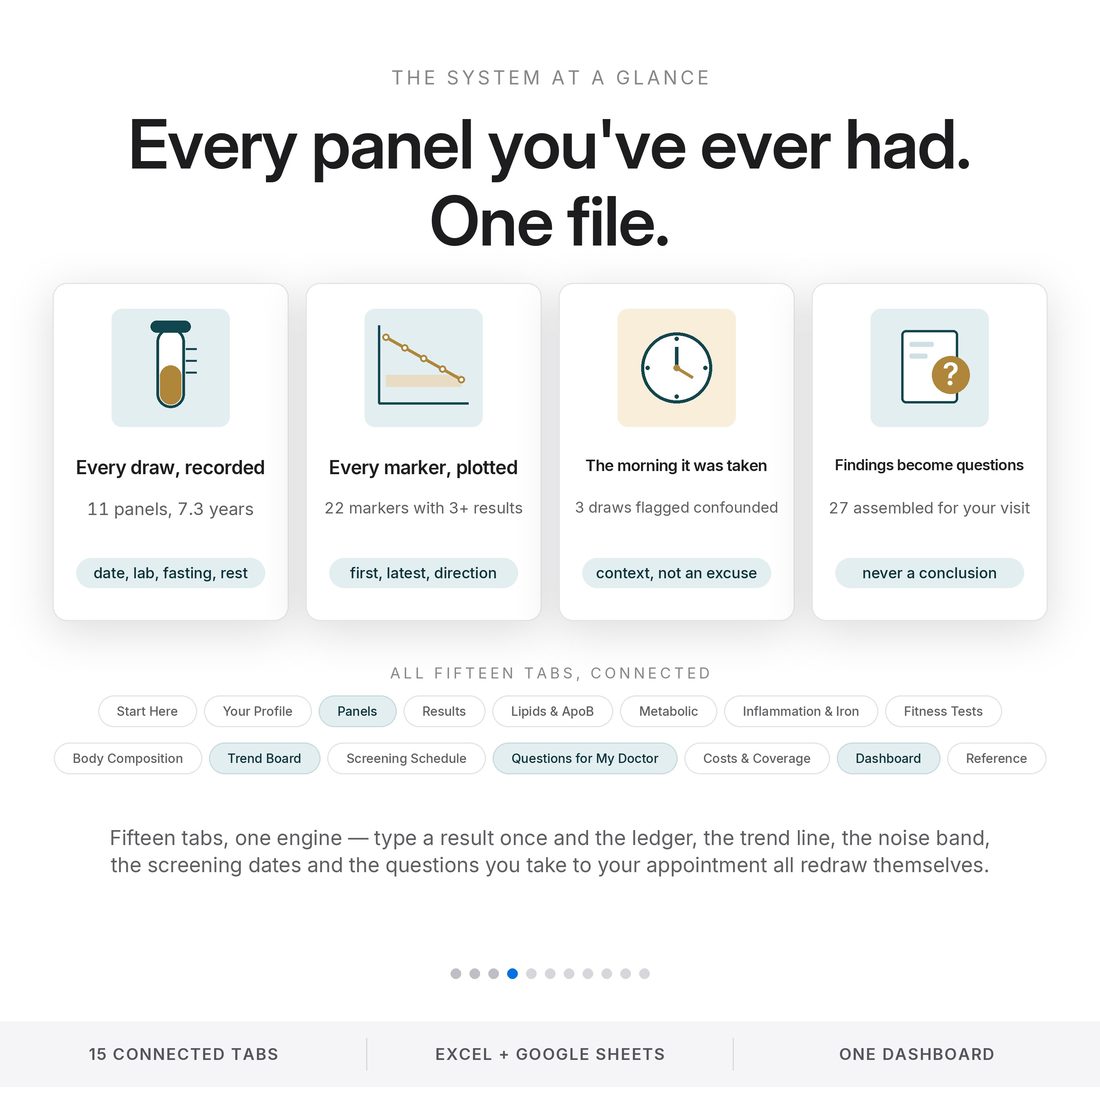
- 11 panels, 23 analytes, 227 results in the shipped sample — 7.3 years on one page
- Questions tab — what came out of the data, assembled for your next appointment
- No diagnosis, no targets, no verdicts — record-keeping that respects the clinician's job
Overview
Normal is a population. You are a trend.
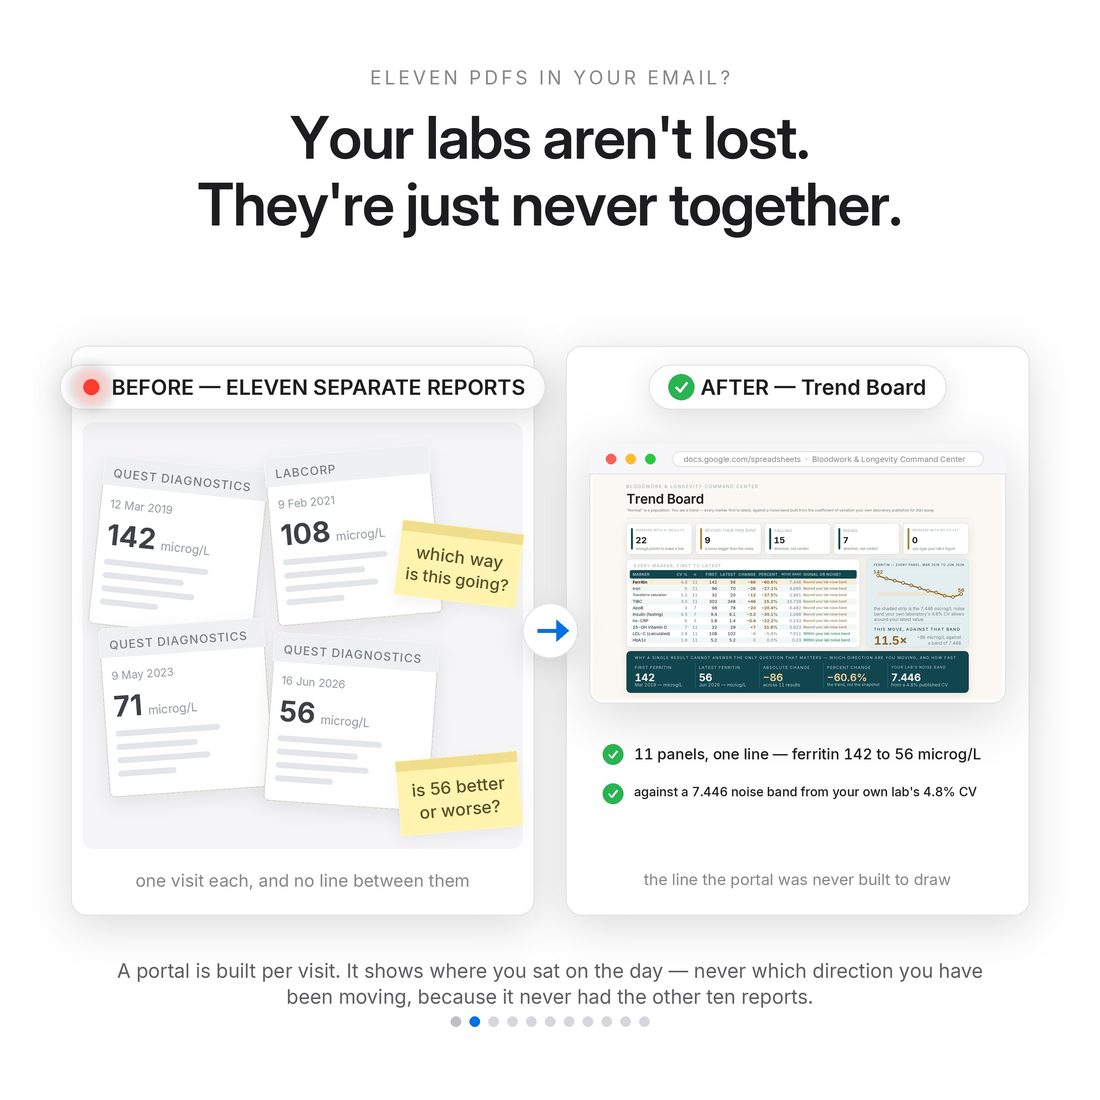
Every lab report grades you against a band drawn from a population that includes plenty of unwell people. It answers one question: are you an outlier today. It cannot answer the one that matters — which direction are you moving, and how fast. A single ferritin value tells you nothing. A ferritin that fell from 142 to 56 across seven years is a line, and no patient portal will ever draw it, because portals are built per visit and you are not a visit. This one is built per person: you type one row per draw, and every tab redraws.
Eleven PDFs, one page.
What's Included
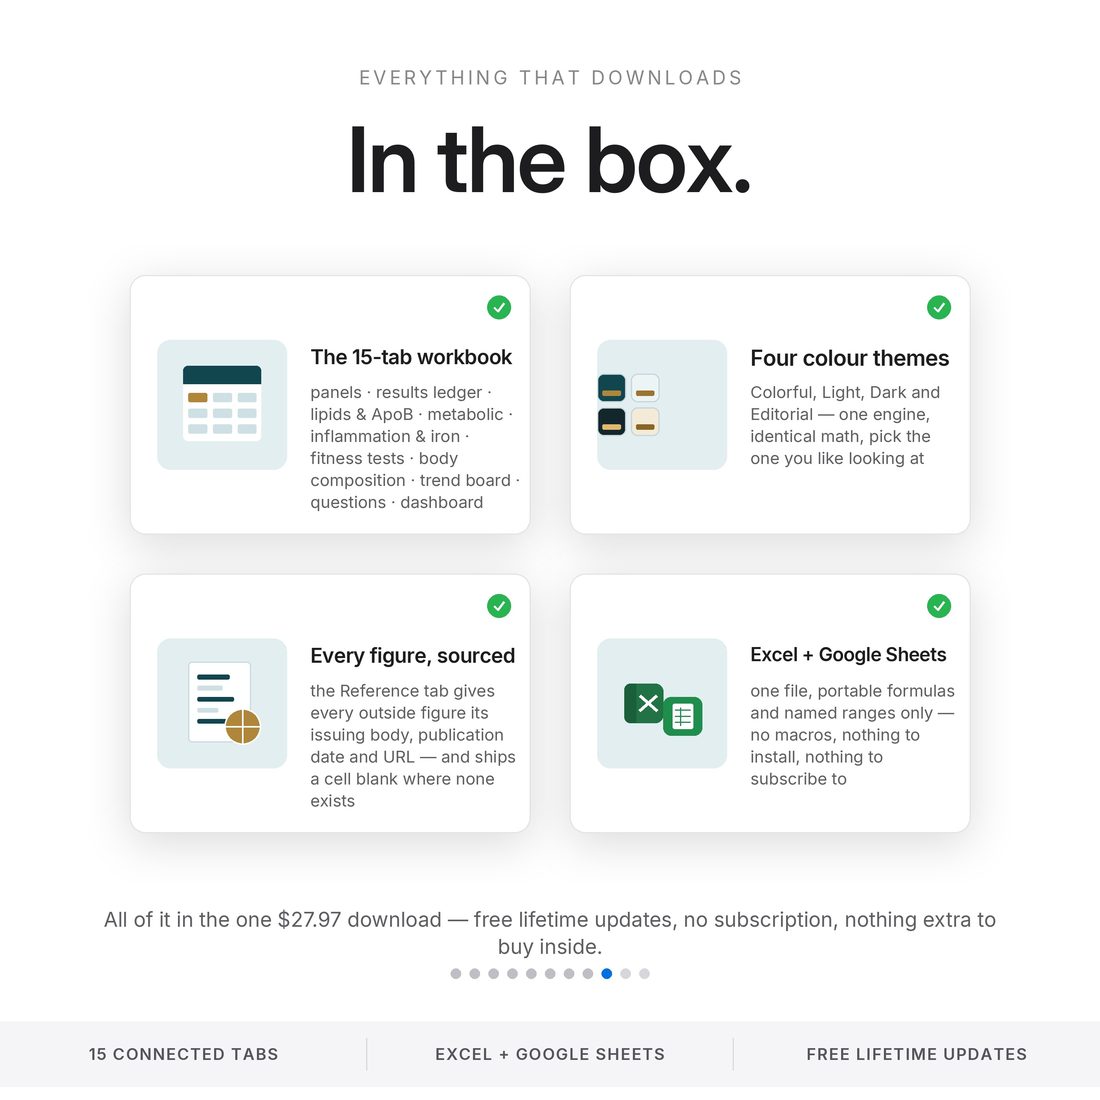
15 connected tabs:
- Bloodwork-Longevity-Command-Center.xlsx — the 15-tab engine (Excel + Google Sheets)
- Bonus Themes folder — the same workbook in Light, Dark and Editorial
- Quick-Start-Guide.pdf + ACCESS-YOUR-TEMPLATE.pdf — one-click Google Sheets access + the video tutorial link
- README + LICENSE — delivered as one ZIP, instant download
Key Benefits
Why this one
Ferritin 142 → 56 over 7.3 years is a 60.6% fall — 11.5× the noise band built from the lab's own published 4.8% CV. Portals never draw that line.
22 markers with three or more results; nine moved beyond their own noise band. For the rest the file says: nothing has been shown to move.
Reference ranges are laboratory-specific — so you type your own lab's, and the file never substitutes a generic band.
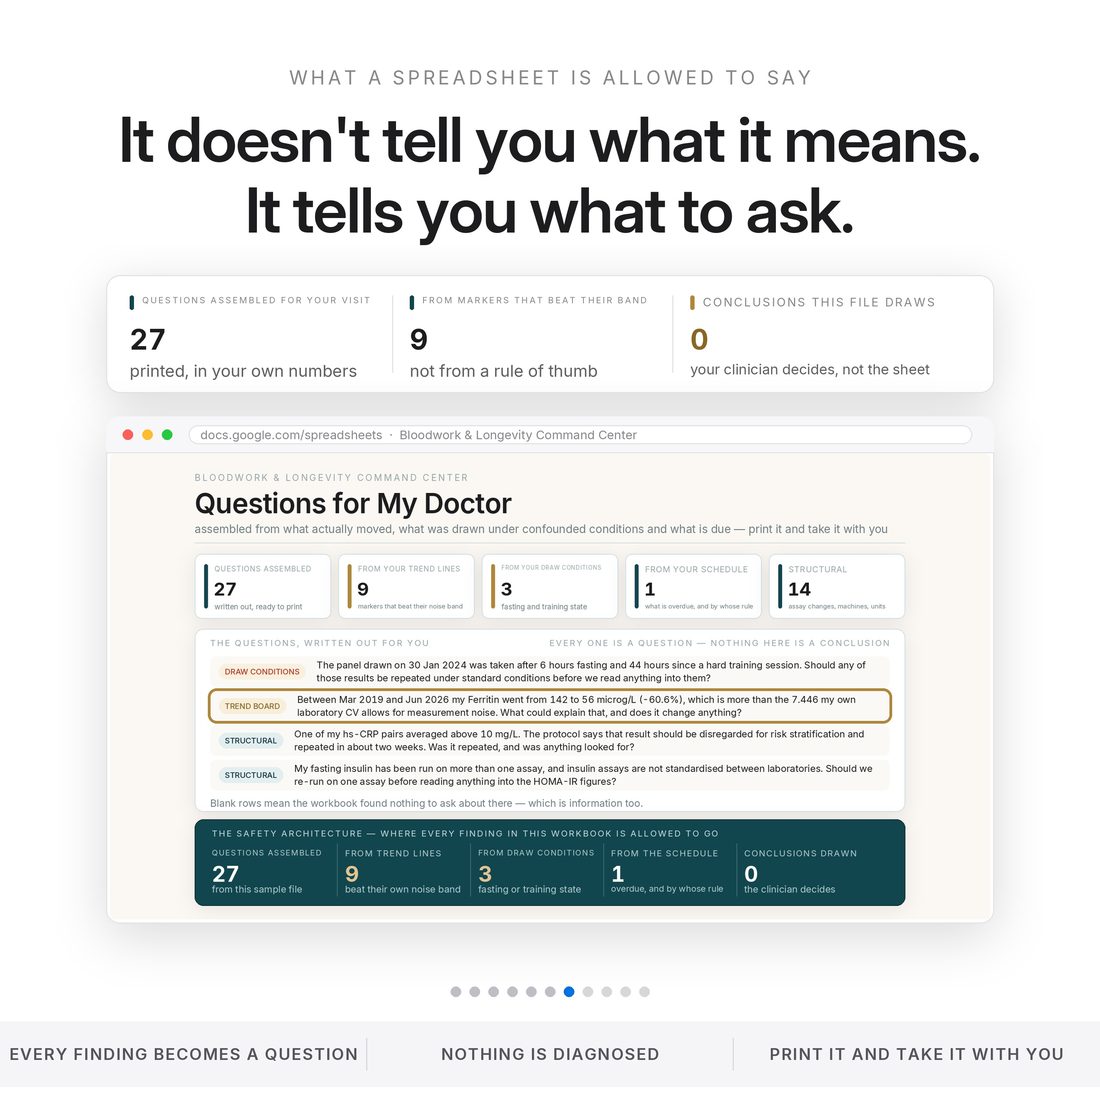
27 questions came out of the sample record. None of them is a conclusion — that job belongs to your clinician.
Every panel's price tracked — you'll know what your data costs and where the duplicates are.
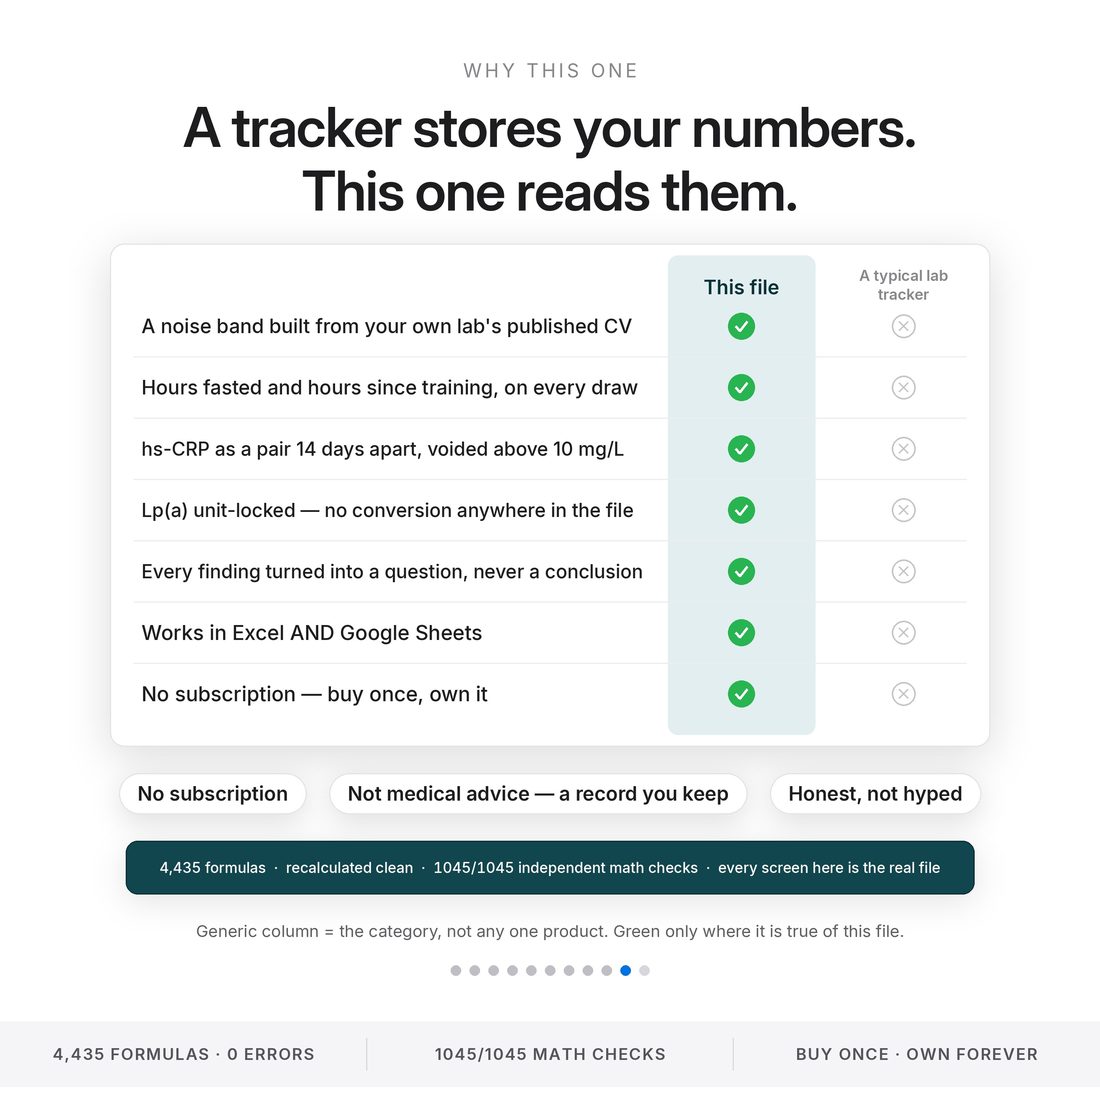
4,435 formulas · recalculated clean · 1045/1045 independent math checks. Every image is the real file.
Who It's For
Built for
- Self-quantifiers with a folder of lab PDFs and no trend line
- Athletes tracking ferritin, lipids and recovery markers over seasons
- Anyone managing a long arc — perimenopause, training, a protocol — who wants their history in one place
- People who want better questions for their next appointment, not internet verdicts
How It Works
Up and running in minutes
The ACCESS-YOUR-TEMPLATE.pdf in your download opens a copy in Google Sheets with one click
Age, training volume, medications, your labs — context the trends will honor
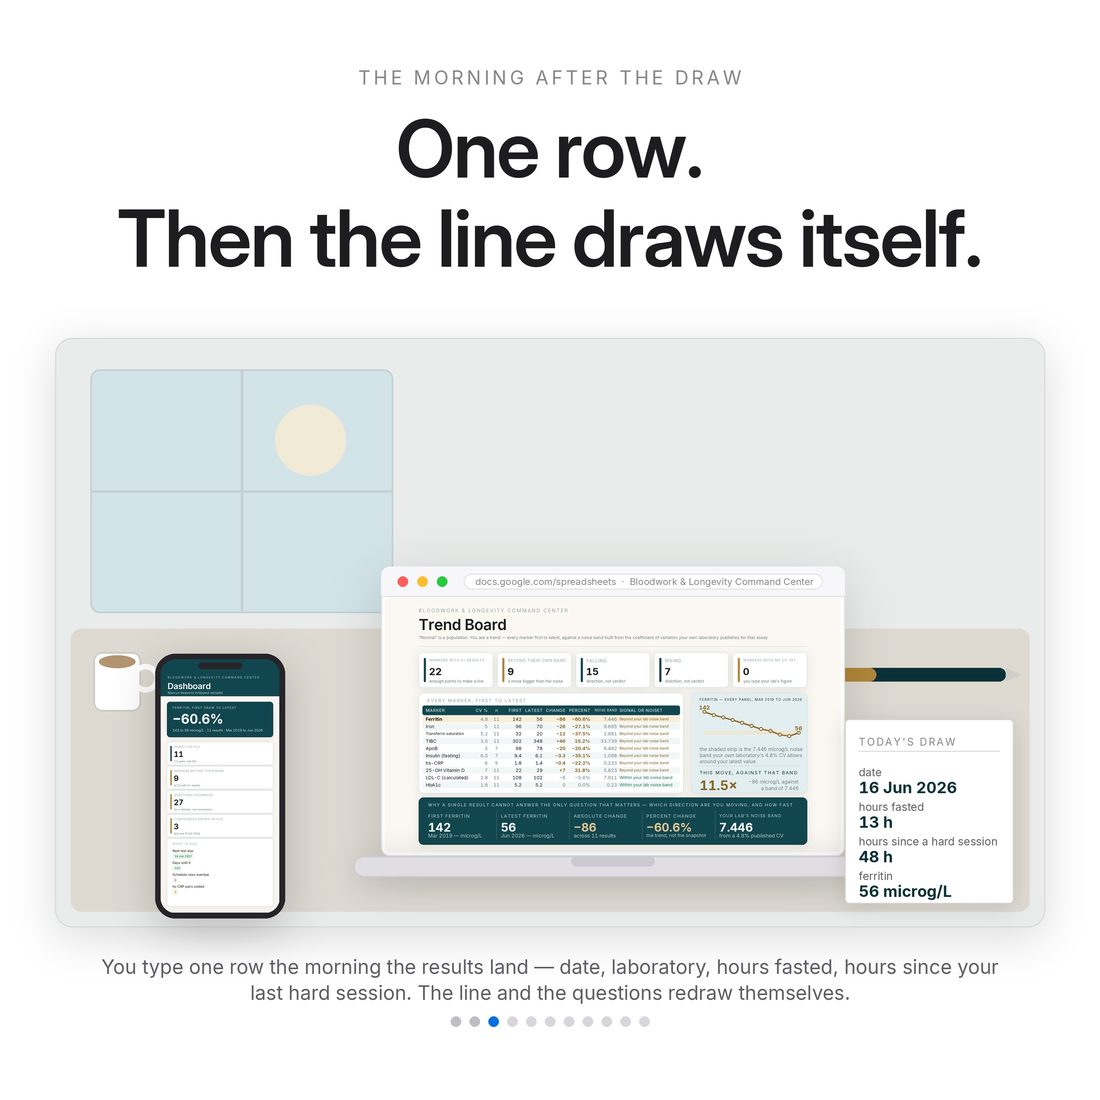
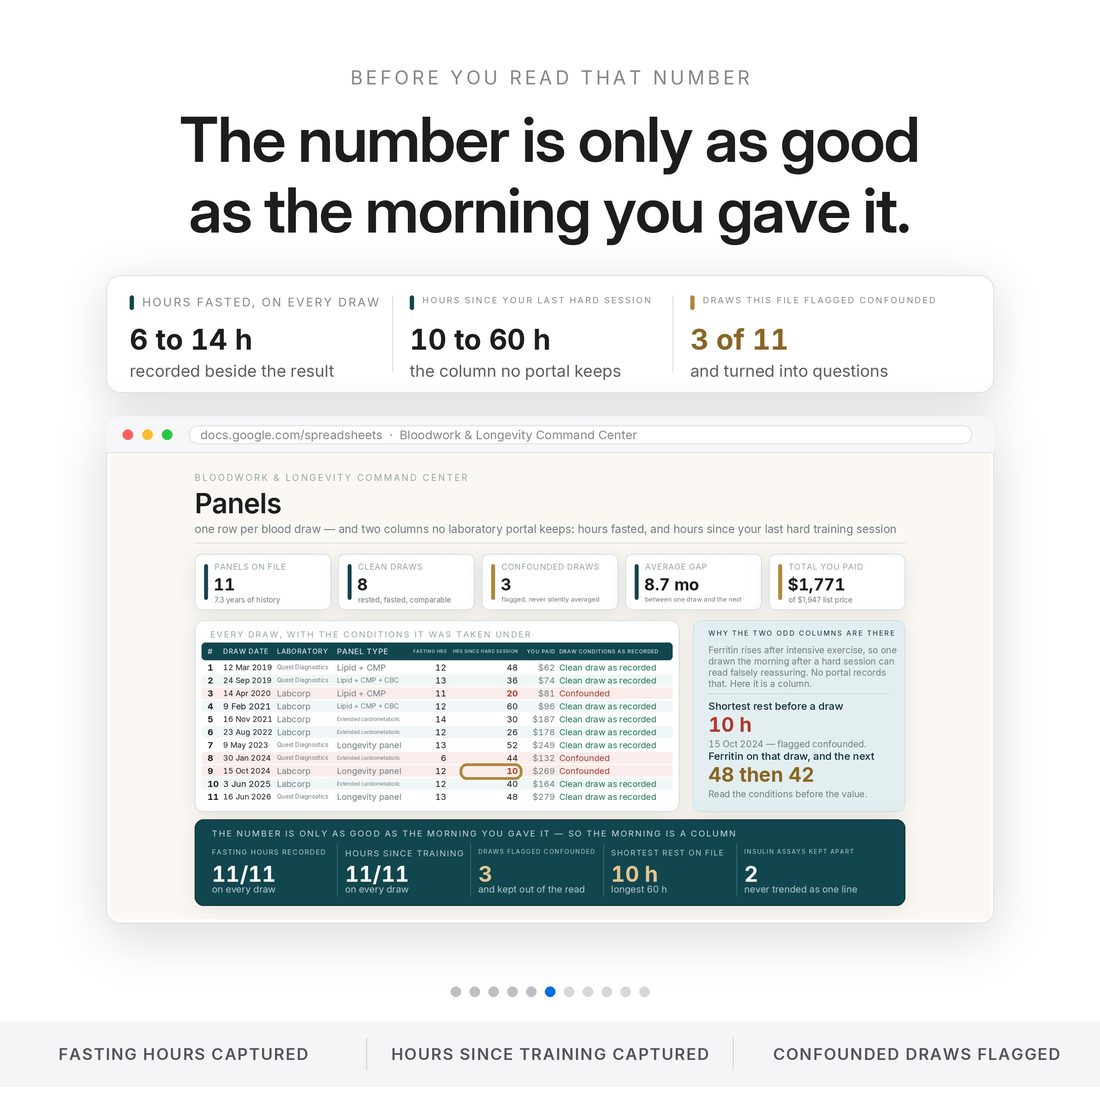
One row per panel: date, lab, fasted hours; then the results with YOUR lab's ranges
Every analyte charted against its own noise band — movement vs noise, honestly split
The Questions tab assembles what the data raised — for a clinician to interpret
Why It's Different
Not another template
Portals are built per visit; trackers grade you against population bands. This file is built per person: your analytes, your lab's ranges, your lab's noise — and a hard rule that it records and plots but never interprets. The disclaimer is printed first, not last.
Delivery & Compatibility
Instant, and works with what you use
As soon as your order is complete you get instant access to download your files. Prefer Google Sheets for real-time updates and dropdowns? It's fully optimized. More comfortable in Excel? It works just as well.
Built and tested in the latest Excel (Office 365). On Mac we recommend the Google Sheets version — the template is not compatible with Apple Numbers. Available in English. The template ships with sample data so every screen works on open; clear it whenever you're ready. The images and video show that sample data to demonstrate how it looks in use.
FAQ
Questions, answered
Does it work in Google Sheets?
Yes — one click: the ACCESS-YOUR-TEMPLATE.pdf in your download opens a copy straight into Google Sheets. The .xlsx works in Excel too.
Does it tell me if my results are good or bad?
No — deliberately. It plots your trend against your own lab's stated range and noise band, and assembles questions. Interpretation belongs to your clinician.
Where do the reference ranges come from?
From you — ranges are laboratory-specific, so you type the range printed on each report rather than accepting anyone's generic band.
Can it import my lab PDFs automatically?
No — entry is one row per draw, by design. Typing 227 results took the sample about an evening, and the file is built to be lived in from there.
Is anything pre-loaded?
A complete sample record (Marcus Ilesanmi — written sample data) ships inside so every screen works on open — it types over in one pass.
Can I get a refund on a digital download?
Because delivery is instant, all sales are final — but message us with any issue and we'll make it right.
This is a record-keeping and plotting tool — not medical advice, not a diagnosis, not a screening test, not a medical device. It never suggests starting or stopping anything. Take the questions to a clinician and let them do the interpreting. For personal use only. © 2026 NicheToolkitHub — no resale or redistribution.