 ▶
▶

 ▶
▶Investment Portfolio Tracker
What you own, what it cost, what it is worth.
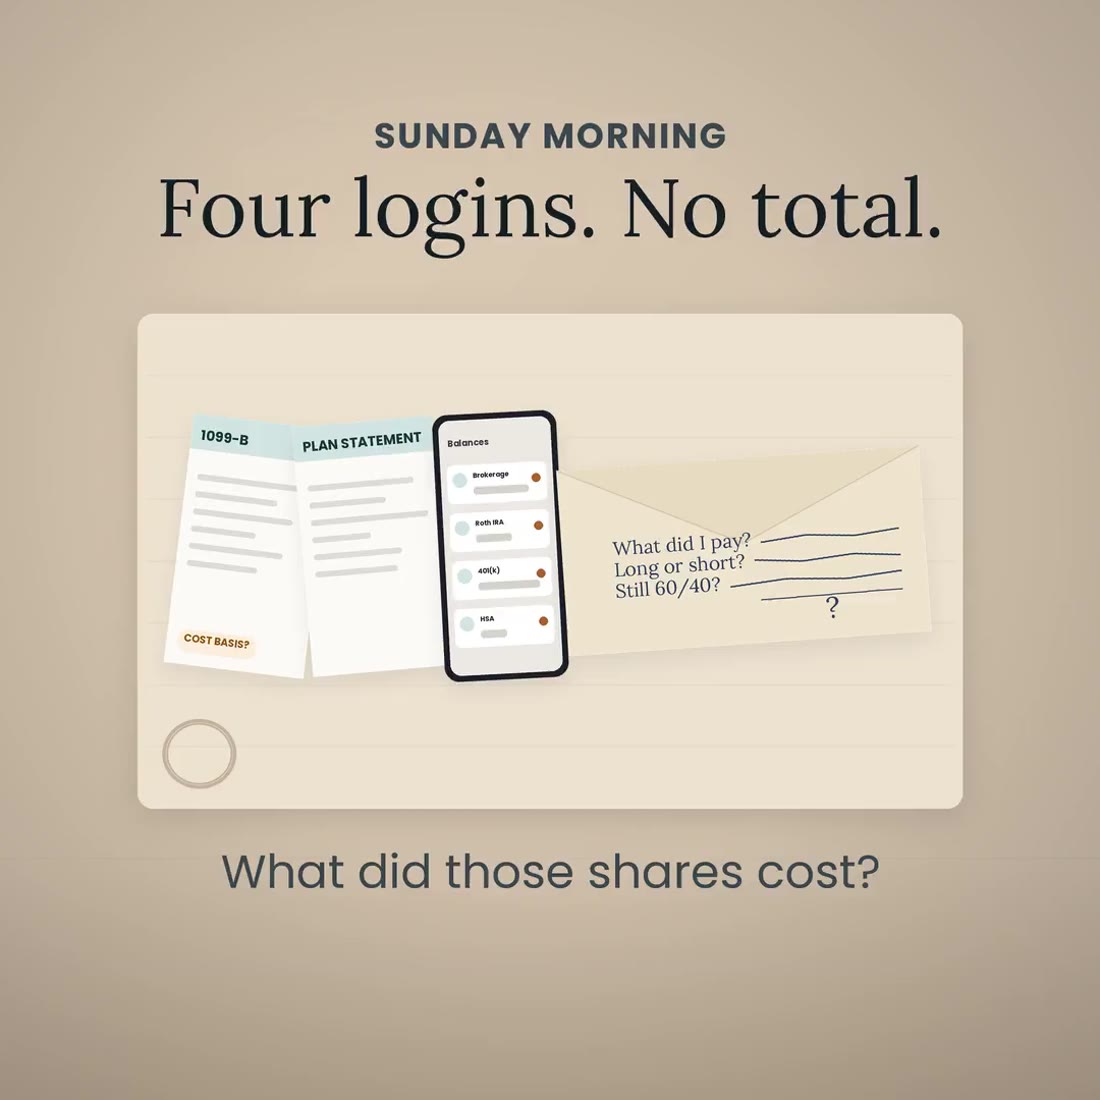
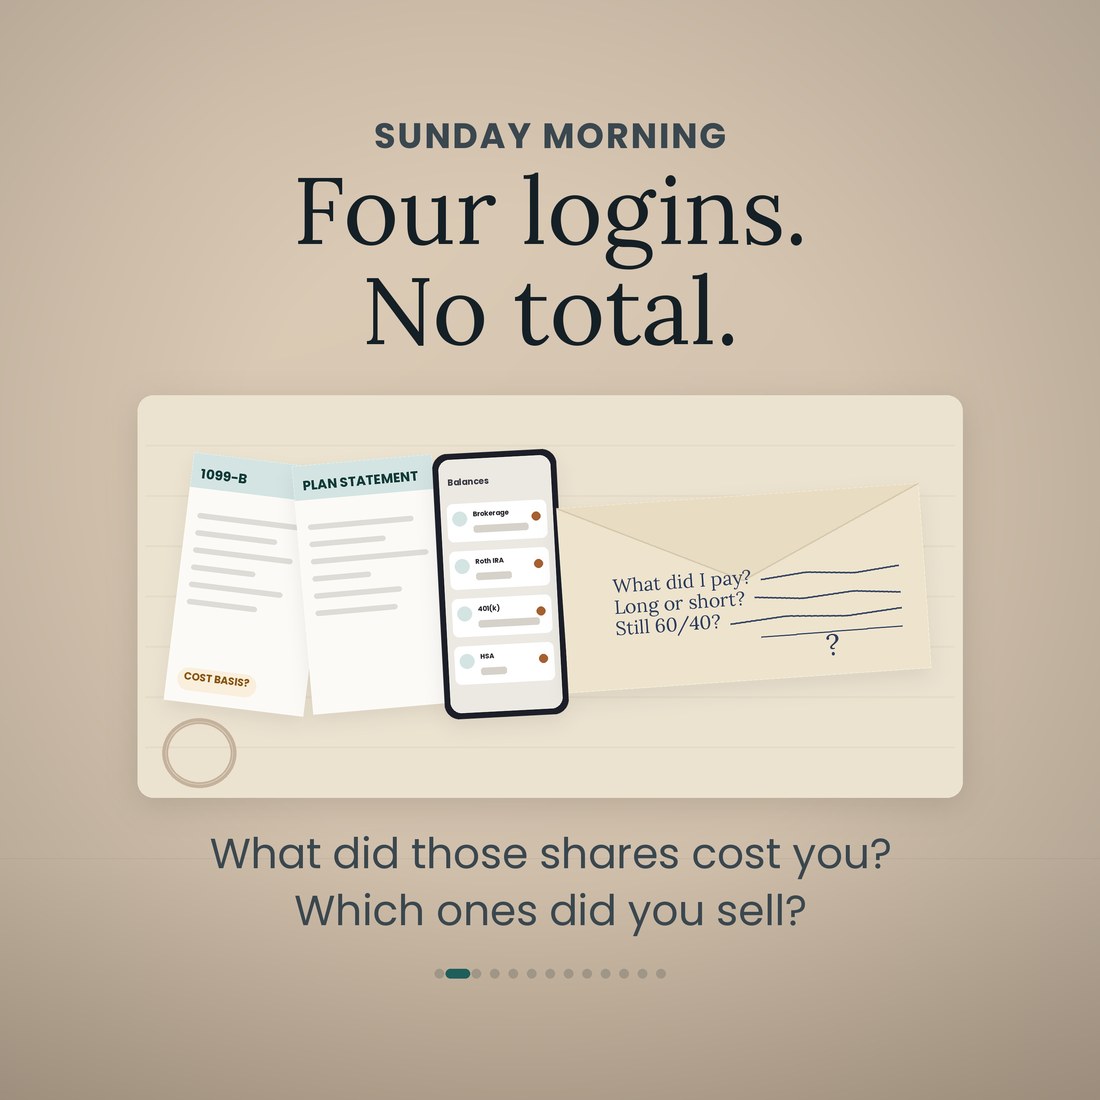
Four accounts, three apps, and none of them add up. The brokerage knows what one account holds, the plan knows about the plan, and nobody knows what you own. Then you sell, and the question that decides the tax is not what the shares are worth, it is which shares you sold and how long you had held them. This file keeps the whole book in one place: every lot with what it cost, every sale matched to the lots it actually came from, and the long-term and short-term split written out the way your preparer wants to see it.
- Transactions, one row per buy, sell, dividend, contribution, interest and fee, dated, with the account and the ticker picked from a drop-down. It is the only place a trade is typed, and 400 rows are waiting
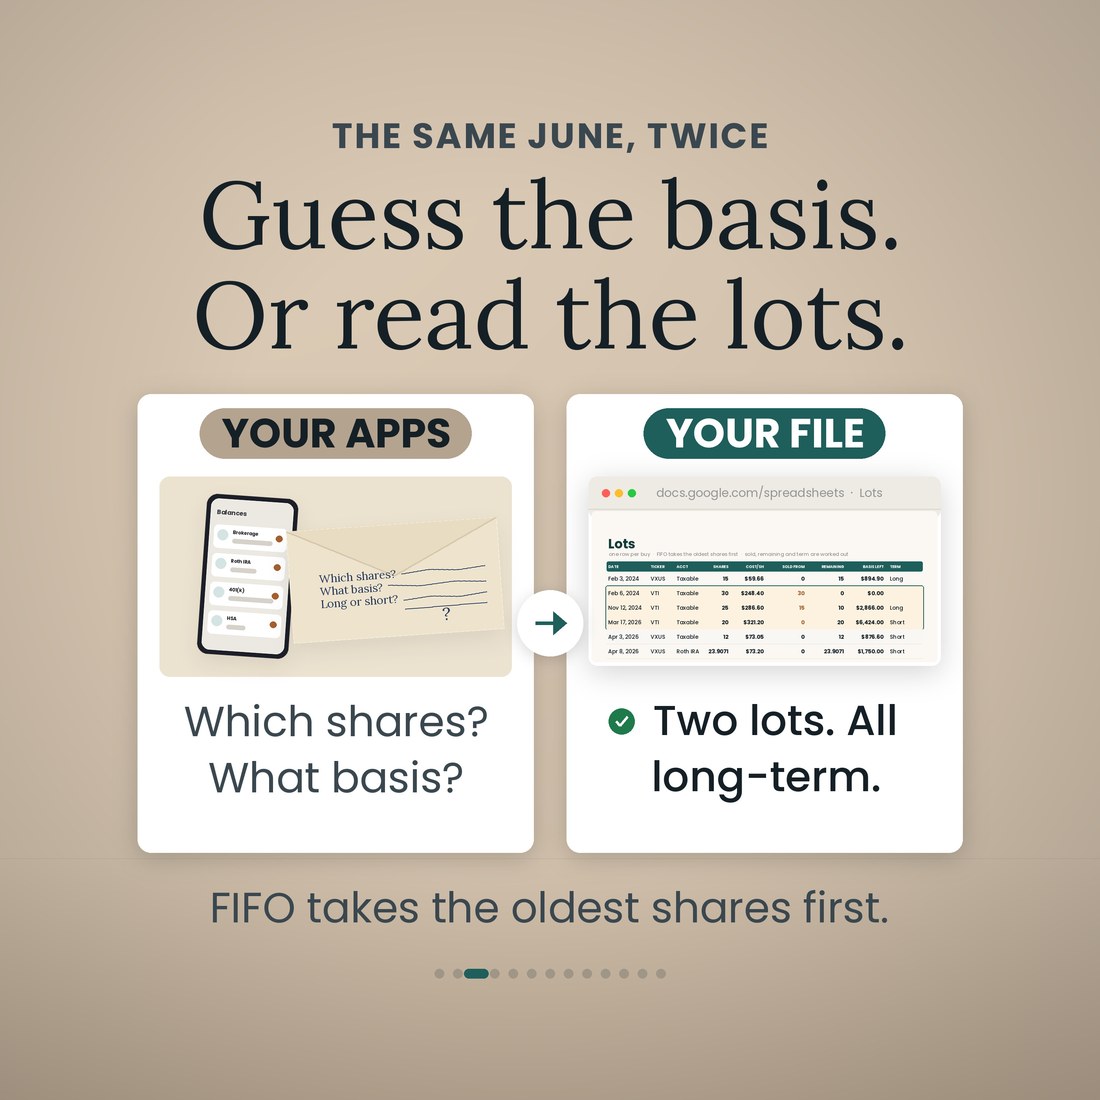
- Lots, one row per buy: what it cost per share, how many shares first-in-first-out has already taken out of that lot, what is left, what the remainder is worth at the price you typed, and whether the remainder is long-term or short-term against the one-year holding rule you set on Setup
- Positions, one row per holding per account: shares, average cost, basis, last price, market value, unrealized gain, income to date, yield on cost, the expense ratio and what that expense ratio costs you a year in dollars
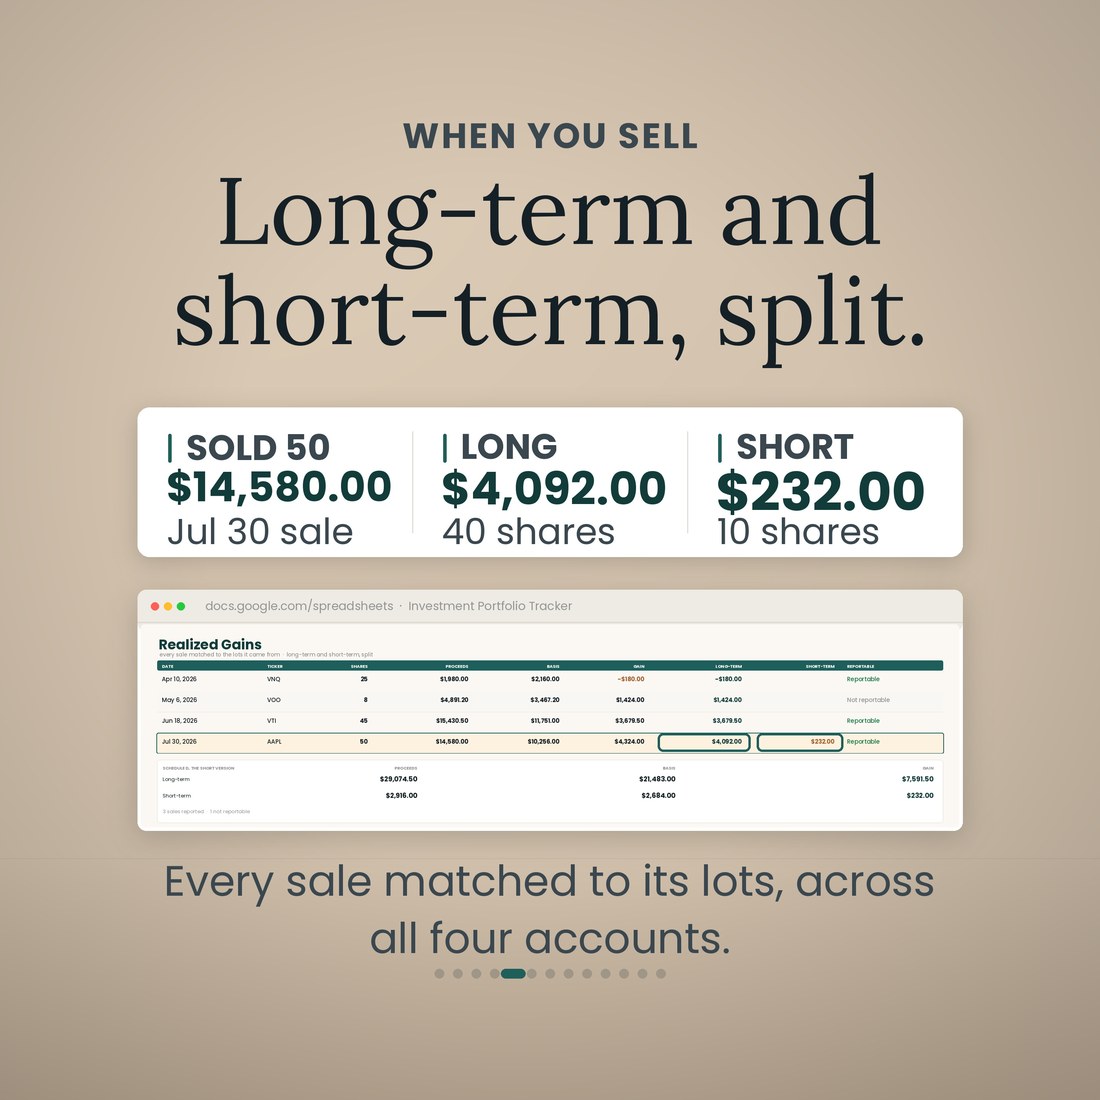
- Realized Gains, every sale matched to the lots it came from, with the proceeds, the basis and the gain split long-term and short-term, a reportable flag so a sale inside a Roth IRA or a 401(k) is left out of the totals, and a Schedule D block under the rows that adds the columns up
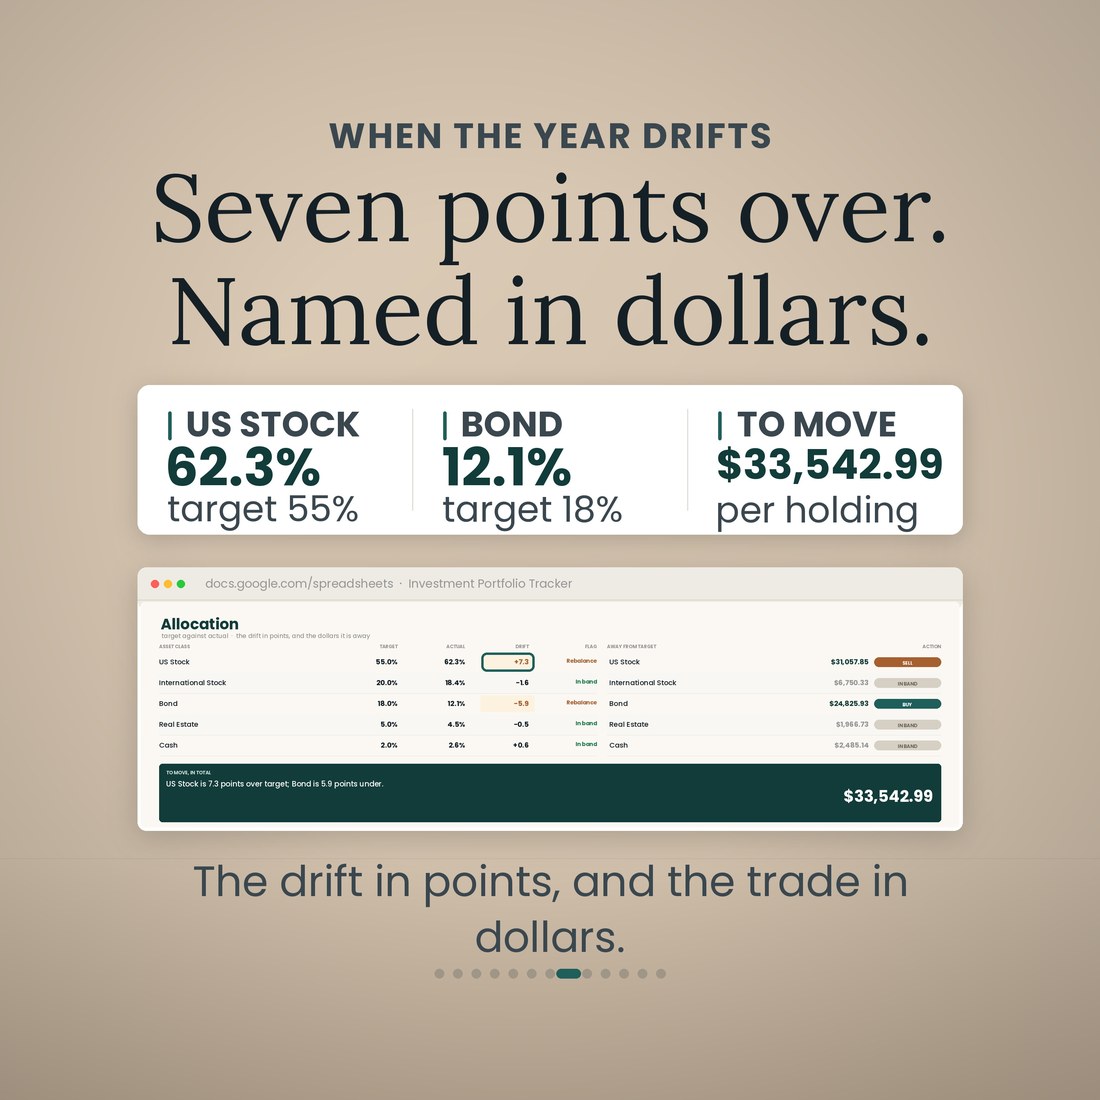
- Allocation and Rebalance, target against actual per asset class, the drift in percentage points, whether each class is inside the band you set, and the same drift turned into dollars per class and then per holding above a cash floor you set. It is arithmetic on your own targets, and it is not advice about what to hold
Overview
What you own, what it cost, what it is worth.
Four accounts, three apps, and none of them add up. The brokerage knows what one account holds, the plan knows about the plan, and nobody knows what you own. Then you sell, and the question that decides the tax is not what the shares are worth, it is which shares you sold and how long you had held them. This file keeps the whole book in one place: every lot with what it cost, every sale matched to the lots it actually came from, and the long-term and short-term split written out the way your preparer wants to see it.
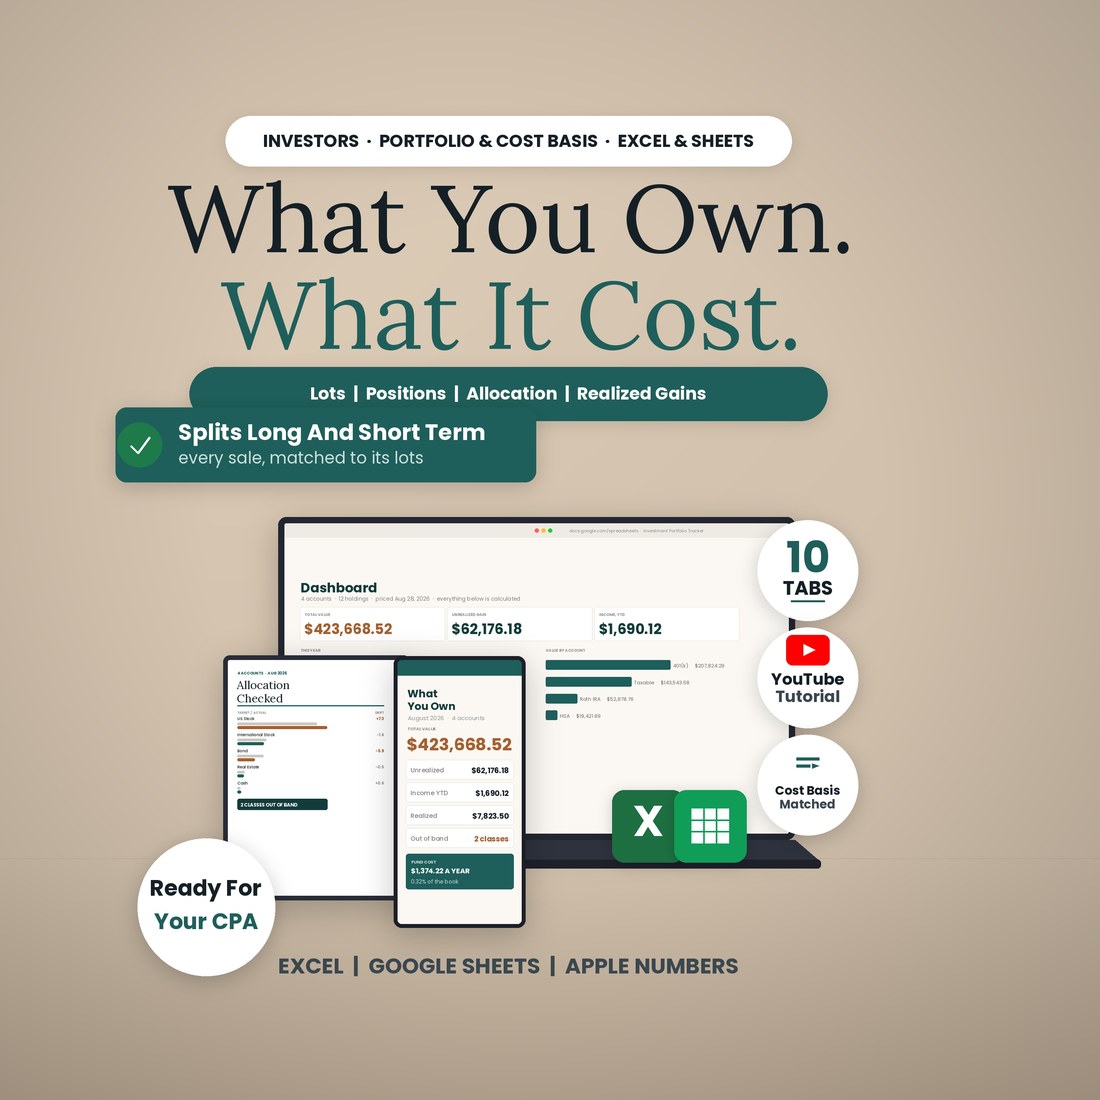
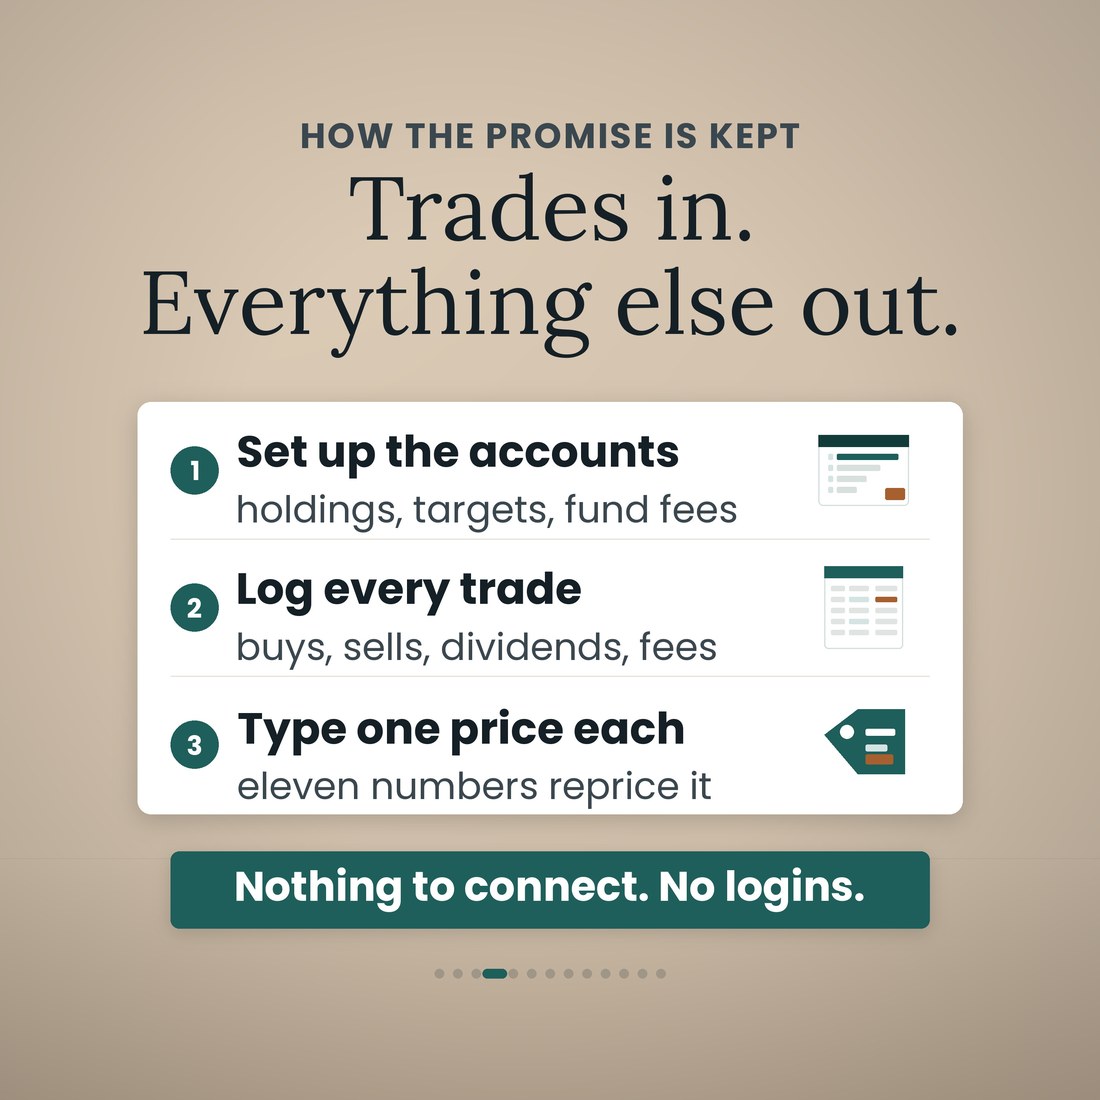
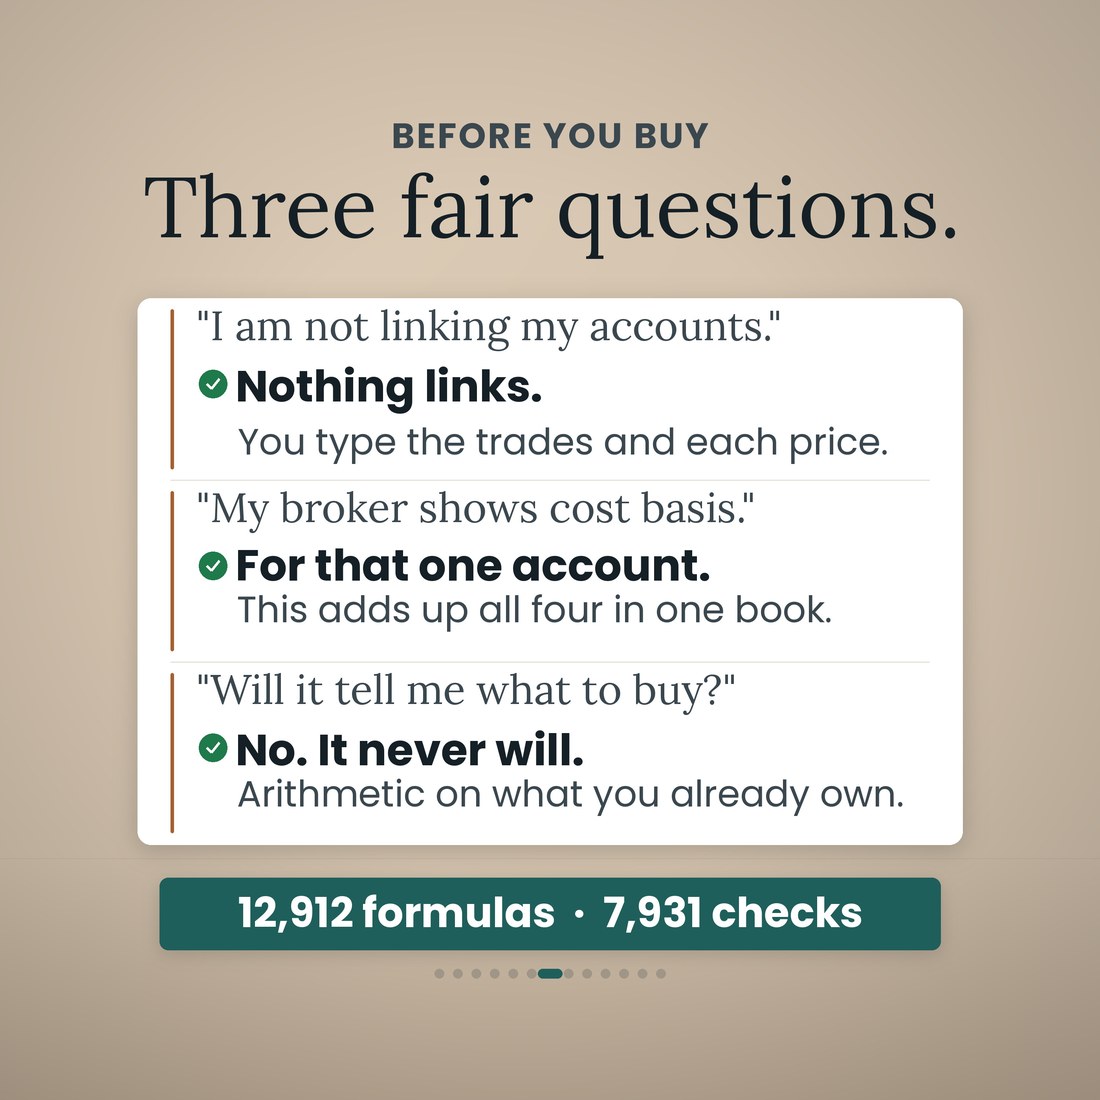
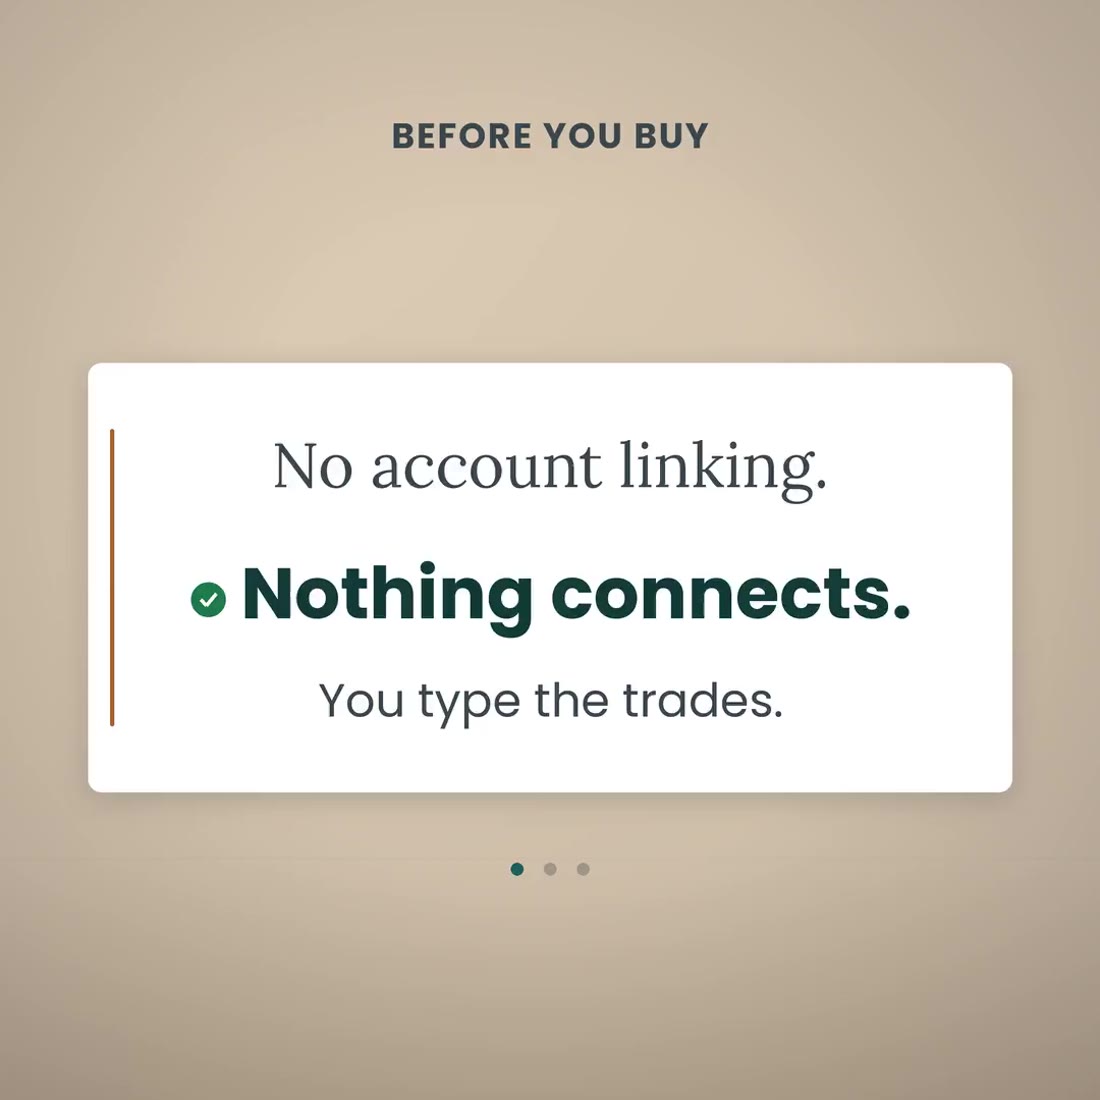
It is one workbook with 10 tabs and 12,912 formulas, and it opens the same way in Microsoft Excel, Google Sheets and Apple Numbers because every formula uses the portable function set — no add-ins, no macros, no login and nothing to install. Nothing links either: there is no API key and no broker or bank connection anywhere in the file. You type in the cream cells only: your accounts, holdings and targets once, a row per trade, and one price per holding when you want the book repriced, which is eleven numbers in the sample book. The lots, the first-in-first-out matching, the basis, the market value, the realized gain split long-term and short-term, the allocation drift, the rebalance dollars, the Dashboard and the Year View are all read, never typed. The file holds 6 accounts, 18 holdings, 400 transaction rows, 300 lot rows and 60 sale rows. A worked sample ships inside — an invented four-account household book, January 2024 to August 2026, 289 transactions, 107 lots and four sales, $423,668.52 of market value against $361,492.34 of basis — so every tab has something to show. Every share price in it was made up to show the arithmetic. Clear the sample rows and the formulas stay.
What's Included
One workbook, 10 tabs, in four color editions:
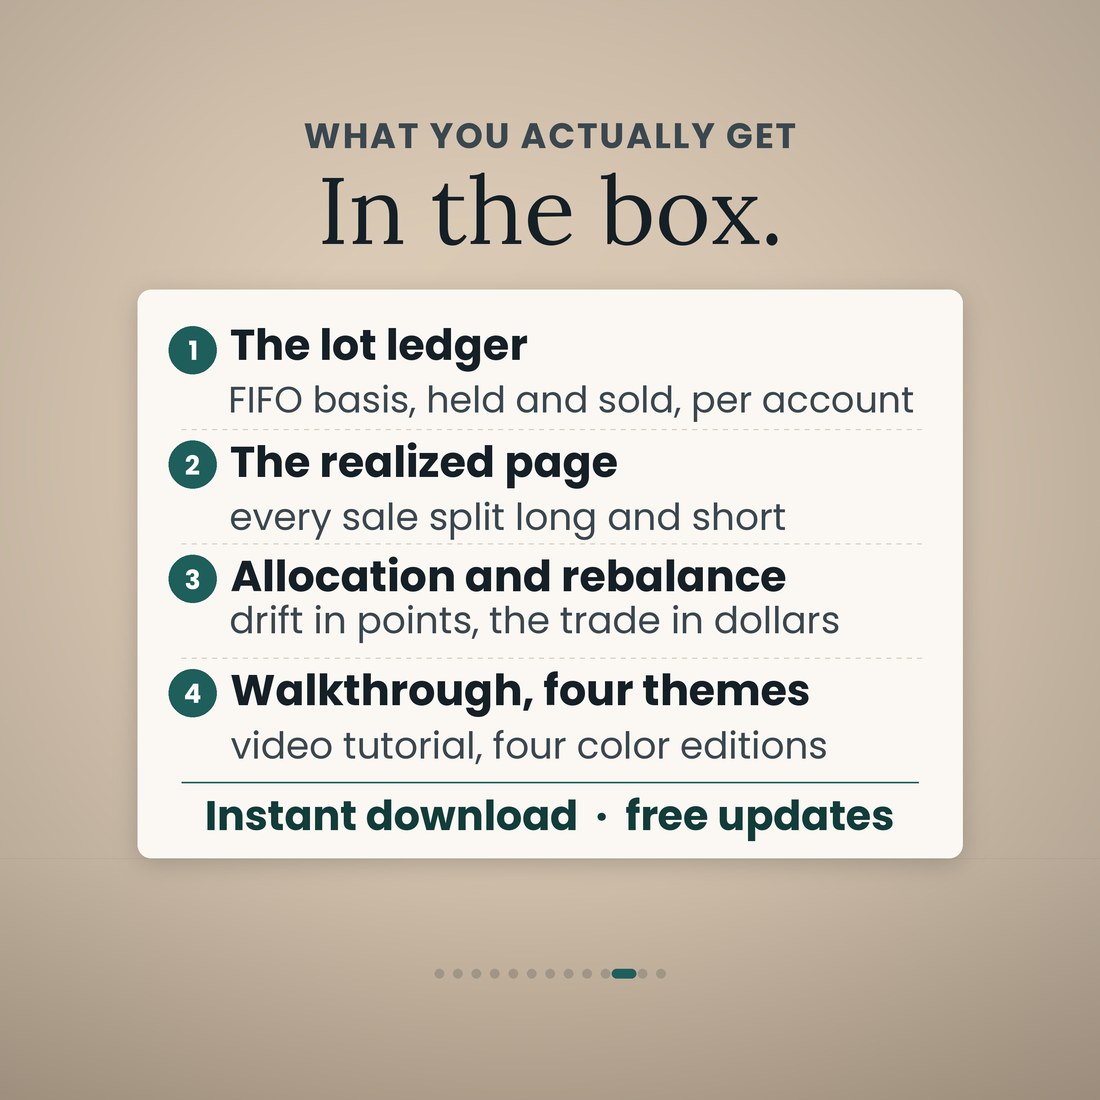
- Investment-Portfolio-Tracker-Spreadsheet.xlsx: the 10-tab workbook with 12,912 formulas, opening in Microsoft Excel, Google Sheets and Apple Numbers
- The same workbook in four color editions — Colorful, Light, Dark and Editorial — every one doing the same arithmetic
- A worked sample book inside: an invented four-account household, 289 transactions, 107 lots and four sales from January 2024 to August 2026, so every tab works on open
- The Realized Gains page with every sale matched to its lots and a Schedule D block that splits long-term from short-term, ready to hand to your preparer
- A full narrated video walkthrough on YouTube, linked on your confirmation page
- Five .xlsx files in one ZIP, instant download. Nothing is shipped and there is nothing to install
Key Benefits
Why this one
Forty-five shares of VTI sold on June 18, 2026 at $342.90. Priced against the most recent buy it looks like a $976.50 gain, and it would have read short-term. Matched to the lots it actually came from, thirty shares from February 2024 and fifteen from November 2024, the basis is $11,751.00 and the gain is $3,679.50, every dollar of it long-term. That is $2,703.00 of difference on one sale, and a different tax rate.
Fifty shares of AAPL sold on July 30, 2026 at $291.60 came off two lots: forty shares held since May 2024 and ten bought in January 2026. The page splits the sale where the lots split it, $4,092.00 long-term on 40 shares and $232.00 short-term on 10, and the Schedule D block under the rows carries the proceeds, the basis and the gain on each side.
The sample holds a taxable brokerage, a Roth IRA, a 401(k) and an HSA: $423,668.52 of market value against $361,492.34 of basis across 12 holdings. The 8-share sale inside the Roth IRA on May 6, 2026 is logged like any other sale and flagged Not reportable, so it stays out of the Schedule D totals while the year's reportable gain reads $7,823.50, $7,591.50 of it long-term and $232.00 short-term.
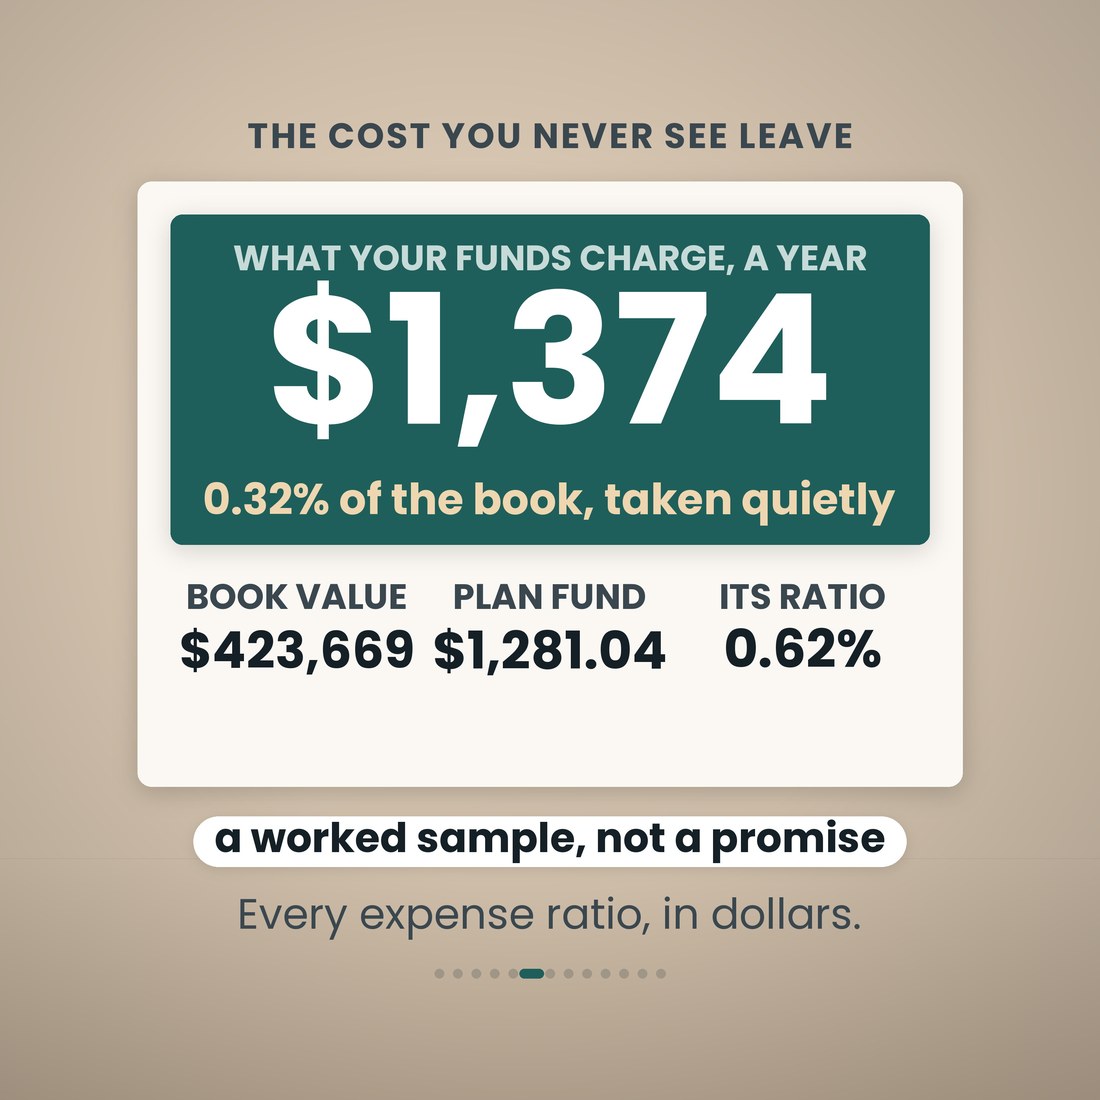
The Positions tab turns each holding's expense ratio into dollars — market value times the ratio, per holding, per year. On the sample that is $1,374.22 a year, and $1,281.04 of it is a single plan fund charging 0.62 percent. The Dashboard says it in a sentence, so the number sits on the page instead of inside a statement.
Target against actual per asset class, the drift in percentage points, and a band you set. On the sample, US stock is 7.3 points over target and bonds are 5.9 points under, which is $24,825.93 of bonds short. The Rebalance tab puts that drift in dollars per class and then per holding, above a $2,000.00 cash floor, and says nothing about whether you should act on it.
Microsoft Excel, Google Sheets and Apple Numbers. Every formula uses the portable function set, and the file was recalculated clean before shipping — 7,931 checks, no failures. No add-ins, no macros, no login, no API key and nothing connected to a broker or a bank.
Who It's For
Built for
- People holding across a taxable brokerage and one or more retirement accounts who keep their own records
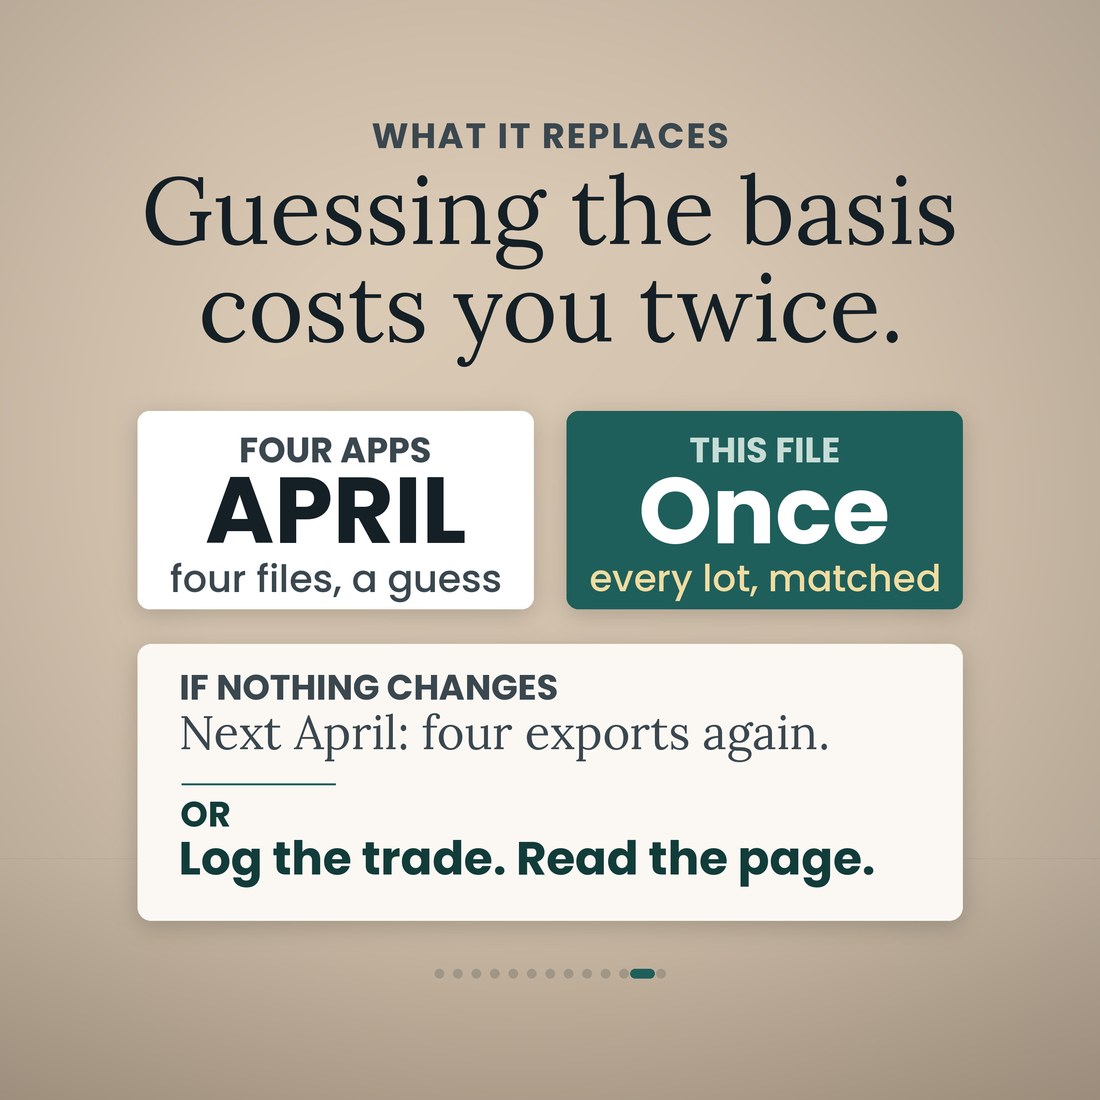
- Anyone who has tried to work out a cost basis in April from three exports and a plan statement
- Anyone who wants the allocation question answered in dollars rather than by feel, on their own target percentages
- People who want the book on their own laptop, with no login, no API key and nothing linked to a broker or a bank
How It Works
Up and running in minutes
Each account with its type and whether a sale in it is taxable, each holding with its asset class and expense ratio, your target percentage per asset class, the drift band, the cash floor and the one-year holding rule. Six account rows and eighteen holding rows. Once.
One row per buy, sell, dividend, contribution, interest and fee, dated, with the account and the ticker from a drop-down. The lots, the first-in-first-out matching and the basis follow from that row.
One cell per holding and one priced-as-of date. In the sample book that is eleven numbers. Nothing is fetched, so the book is priced as of the last time you typed, and it says so on the page.
Every sale matched to its lots, the long-term and short-term split, the sales inside a Roth IRA or a 401(k) flagged Not reportable, and the Schedule D block under the rows. Hand it to your preparer.
What the book is worth at the prices you typed, what it has earned, the realized split, the sentence naming what your funds charge you a year, then target against actual per class and the same drift in dollars on the Rebalance tab. What you do about it is yours to decide.
Why It's Different
Not another template
Most portfolio spreadsheets are a holdings list with a market value column, and the broker's own statement is treated as the answer. That statement covers one account. This file holds the whole book: every account, every holding, every lot, with the price per share you paid and the date you paid it. The part that matters is the matching. Log a sale and the file walks the lots for that holding in that account oldest first, takes the shares it needs and works out the basis from what those shares actually cost, so the arithmetic sits on the page in front of you instead of arriving in February on a form. On the sample that is the difference between a $976.50 short-term reading and a $3,679.50 long-term one on the same 45-share sale, $2,703.00 apart. It also prices the thing nobody watches leave the account: each holding's expense ratio turned into dollars a year, $1,374.22 on the sample, $1,281.04 of it from one plan fund at 0.62 percent. And nothing links — no login, no API key, no broker or bank connection — so the file is yours and the prices are the ones you typed. It is honest about its limits too: it gives no investment advice and it does not tell you what to buy, sell or hold; it matches lots first-in-first-out only and does not apply specific-identification elections; it does not compute wash-sale adjustments, foreign tax credits, options, futures, margin or short sales; and with one price per holding rather than a price history it will not draw a value-over-time line, so it does not draw one. Those calls, and the filing, are your preparer's.
Delivery & Compatibility
Instant, and it opens in what you already use
As soon as your order is complete you get instant access to download the ZIP, so you can set your accounts up tonight and have the whole book on one page before the next statement lands.
Five .xlsx workbooks (Investment-Portfolio-Tracker-Spreadsheet.xlsx plus the Colorful, Light, Dark and Editorial editions) delivered as one ZIP, instant download. Opens in Microsoft Excel, Google Sheets and Apple Numbers using the portable function set only — no add-ins, no macros, no login and nothing to install. Nothing links: there is no API key and no broker or bank connection in the file, and every price is a cell you type. The file ships with a worked sample book so every screen works on open; the images and video show that sample, the household in it is invented and every share price in it was made up to show the arithmetic. This is a record-keeping tool. It gives no investment advice, it is not tax, legal or accounting advice, and it does not tell you what to buy, sell or hold. It matches lots first-in-first-out only; it does not compute wash sales and it does not apply specific-identification elections. This is a digital download; nothing is shipped.
FAQ
Questions, answered
I have one brokerage account. Is this too much?
One account is one row on Setup. The file holds six accounts and eighteen holdings if you add a plan, an IRA or an HSA later, and the Transactions, Lots, Positions and Realized Gains tabs do not care how many accounts you keep. With one account you fill one row and read one column on the Dashboard.
My broker already shows my cost basis. Why do I need this?
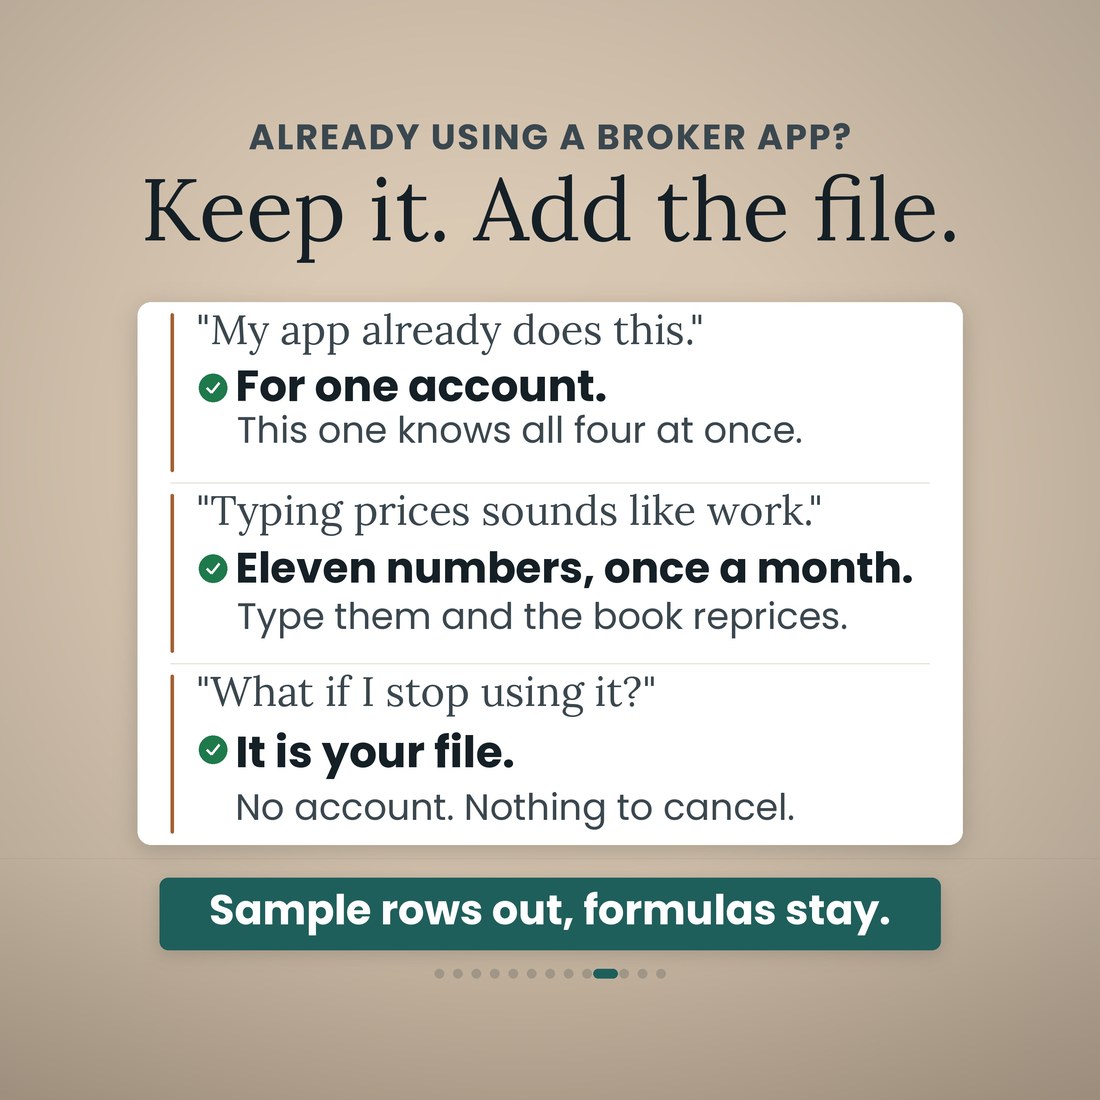
For that one account. This adds all of them up in one book and matches every sale to its lots itself, so you can read the arithmetic instead of waiting for a number that arrives in February. If your broker holds the basis for a holding and you elected something other than first-in-first-out, type your broker's basis over the top.
Will my CPA use it?
The Realized Gains page is laid out the way the question gets asked: every sale, the lots it came from, the proceeds, the basis and the gain split long-term and short-term, with sales inside a Roth IRA or a 401(k) flagged Not reportable and left out of the totals, and a Schedule D block that adds the columns up. Your preparer signs and files; the file does the arithmetic and keeps the lots straight.
What are the ten tabs?
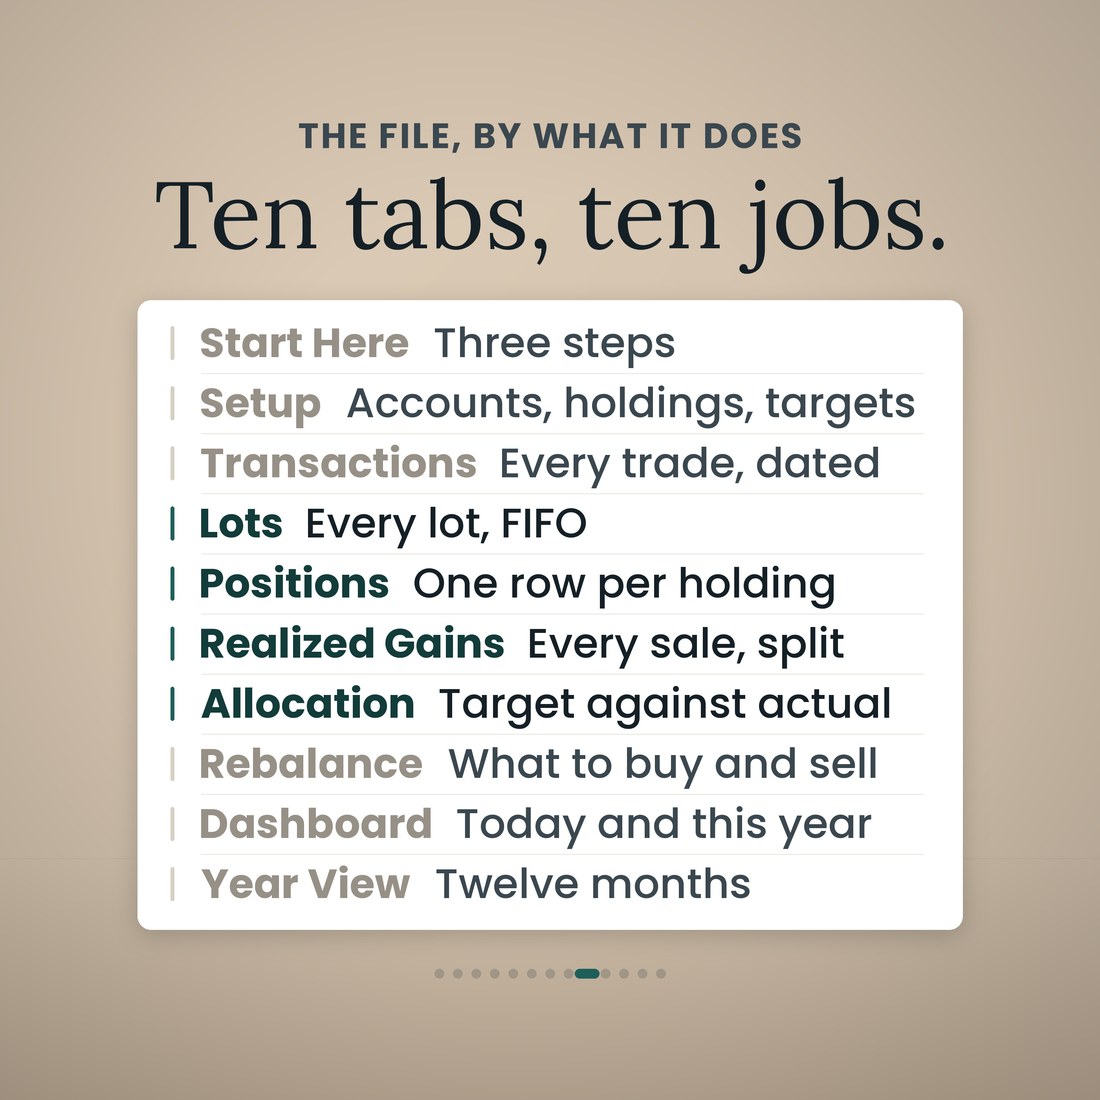
Start Here; Setup; Transactions; Lots; Positions; Realized Gains; Allocation; Rebalance; Dashboard; and Year View. Each does one job.
How does the lot matching work?
Every buy is a lot. When you log a sale the file walks the lots for that holding in that account oldest first, takes the shares it needs and builds the basis from what those shares cost. On the sample, 45 shares of VTI sold on June 18, 2026 at $342.90 came off a 30-share lot from February 2024 and 15 shares of a lot from November 2024: basis $11,751.00, gain $3,679.50, all of it long-term. Priced against the most recent buy the same sale would have read $976.50 and short-term, $2,703.00 apart.
Does it handle wash sales or specific identification?
No, and it says so on the page. It matches first-in-first-out only, which is the default your broker applies unless you told it otherwise. It does not compute wash sales, it does not apply specific-identification elections, and it does not cover options, futures, margin or short sales. Where any of those apply, your preparer's numbers are the ones to use.
I am not a spreadsheet person. How much do I have to type?
The trades and the prices, and nothing else. Every other cell is a formula, 12,912 of them. One price per holding when you want the book repriced, which is eleven numbers in the sample book, plus one priced-as-of date. Nothing is fetched: there is no login, no API key and no bank link anywhere in the file.
What is the difference between the four color editions?
Only the look. Colorful, Light, Dark and Editorial are the same 10-tab workbook with the same formulas in a different palette, and all four ship in the download.
Is this investment or tax advice?
No. It is a record-keeping tool that organizes the trades and prices you enter; it gives no investment advice, it is not tax, legal or accounting advice, and it does not tell you what to buy, sell or hold. It matches lots first-in-first-out only; it does not compute wash sales and it does not apply specific-identification elections. What a sale costs you in tax, and what belongs on the form, are your preparer's call.
For personal use. A record-keeping tool that organizes the trades and prices you enter; it gives no investment advice, it is not tax, legal or accounting advice, and it does not tell you what to buy, sell or hold. It matches lots first-in-first-out only; it does not compute wash sales and it does not apply specific-identification elections. © 2026 NicheToolkitHub — no resale or redistribution.